


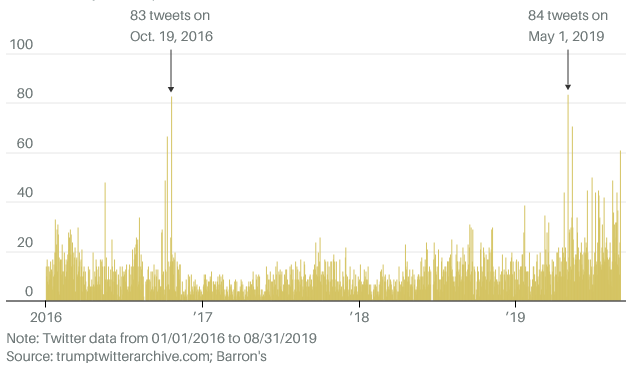
Before Donald Trump was suspended from Twitter, data reported by Barron’s showed his tweets could significantly affect the stock market. For example, after a series of tweets about his plans to place tariffs on imports from China, “the S&P 500 fell 0.9% that Thursday and tumbled almost 3% the next Monday”. His influence on the market is compounded when we consider the frequency of his tweets as well. In the image below, we can see Trump tweeted up to 84 times in a single day between 2016 and 2020.
To reduce any unnecessary risk caused by Donald Trump’s tweets and other public actions, we focus this Idea Streams episode on constructing a portfolio of securities that have a low Trump beta. Trump beta is the correlation between a security's daily returns and Trump's betting odds in the presidential candidate general election.
Our Process
To get the Trump beta values we need, we used the Political Beta data set from Quiver Quantitative. This data set is a daily time series of Trump beta values for a collection of securities. The values range between -1 and 1. A value of 1 means the stock returns are perfectly correlated with Trump’s betting odds. A value of -1 in this data set means the stock returns are perfectly anti-correlated with Trump’s betting odds.
To get the alternative data set into our trading algorithm, we uploaded the data to Dropbox and created a custom data importer to read the Dropbox file. Once the data was in place and the importer was created, we defined our universe to be the securities listed in the Political Beta data set.
symbols = self.get_symbols()
self.add_universe_selection(ManualUniverseSelectionModel(symbols))
To reduce the Trump beta of our portfolio, as the Trump beta values were passed into our algorithm each day, we selected the 25% of securities in our universe that had Trump beta values closest to 0.
trump_beta = pd.Series({k: v.value for k, v in slice.get[TrumpBeta]().items()})
low_trump_beta = abs(trump_beta).sort_values()[math.floor(self.thresh*len(trump_beta)):]
With the securities selected, we then instructed the portfolio construction model to give an equal weighting to each of the securities for the following 7 days. To test the performance of the trading strategy, we ran two backtests with a start date of June 1, 2020. In the first backtest, we selected the securities with the Trump beta values closest to zero. To compare performance, the second backtest selected the securities with the Trump beta values furthest from zero. Before running the backtests, we expected the portfolio that targets high Trump beta values to have a higher annual variance and a larger max drawdown.
Results
The backtests produced the following results:
| Low Trump Beta | High Trump Beta | |
|---|---|---|
| Return | 5.08% | 8.83% |
| PSR | 39.6% | 47.2% |
| Annual Variance | 0.027 | 0.036 |
| Max Drawdown | 9.5% | 11.7% |
In conclusion, the backtest that targeted the highest Trump beta values actually produced a greater return and a higher PSR. However, as we expected, the portfolio with the lowest Trump beta had a lower annual variance and a lower max drawdown.
For those interested in continuing the development of this strategy, we recommend replacing the equal-weighted portfolio with a portfolio weighted by market cap. The weight of each security in the portfolio can then be adjusted based on how much political risk they have. For example, if a stock has a weighting of 2% in the portfolio but has a very high correlation to Trump’s betting odds, we could reduce the weight of the security to 1.5%.
We hope you found this strategy interesting. We think it’s important to look outside the traditional risks in the market and look at how you can leverage alternative data to reduce your political risk. To view the strategy code, clone the backtest below.


Ollie Hooper
The material on this website is provided for informational purposes only and does not constitute an offer to sell, a solicitation to buy, or a recommendation or endorsement for any security or strategy, nor does it constitute an offer to provide investment advisory services by QuantConnect. In addition, the material offers no opinion with respect to the suitability of any security or specific investment. QuantConnect makes no guarantees as to the accuracy or completeness of the views expressed in the website. The views are subject to change, and may have become unreliable for various reasons, including changes in market conditions or economic circumstances. All investments involve risk, including loss of principal. You should consult with an investment professional before making any investment decisions.
To unlock posting to the community forums please complete at least 30% of Boot Camp.
You can continue your Boot Camp training progress from the terminal. We hope to see you in the community soon!