Introduction
In previous chapters, we learnt that the Capital Asset Pricing Model (CAPM) treats the market return as the only factor affecting the return of any asset. This chapter will generalize CAPM to multi-factor models of the following form:
where each is a factor.
Fama-French Three-Factor Model
This model was proposed in 1993 by Eugene Fama and Kenneth French to describe stock returns. The 3-factor model is
where
- MKT is the excess return of the market. It's the value-weighted return of all CRSP firms incorporated in the US and listed on the NYSE, AMEX, or NASDAQ minus the 1-month Treasury Bill rate.
- SMB (Small Minus Big) measures the excess return of stocks with small market cap over those with larger market cap.
- HML (High Minus Low) measures the excess return of value stocks over growth stocks. Value stocks have a higher book to price ratio (B/P) than growth stocks.
Data on these factors can be downloaded from French's website.
Model Test
To test the 3-factor model, we use it to predict returns on NASDAQ US Small Cap Index and NASDAQ US Large Cap Index. We estimate the model with daily returns in the past 6 years.
Results for US Small Cap returns:
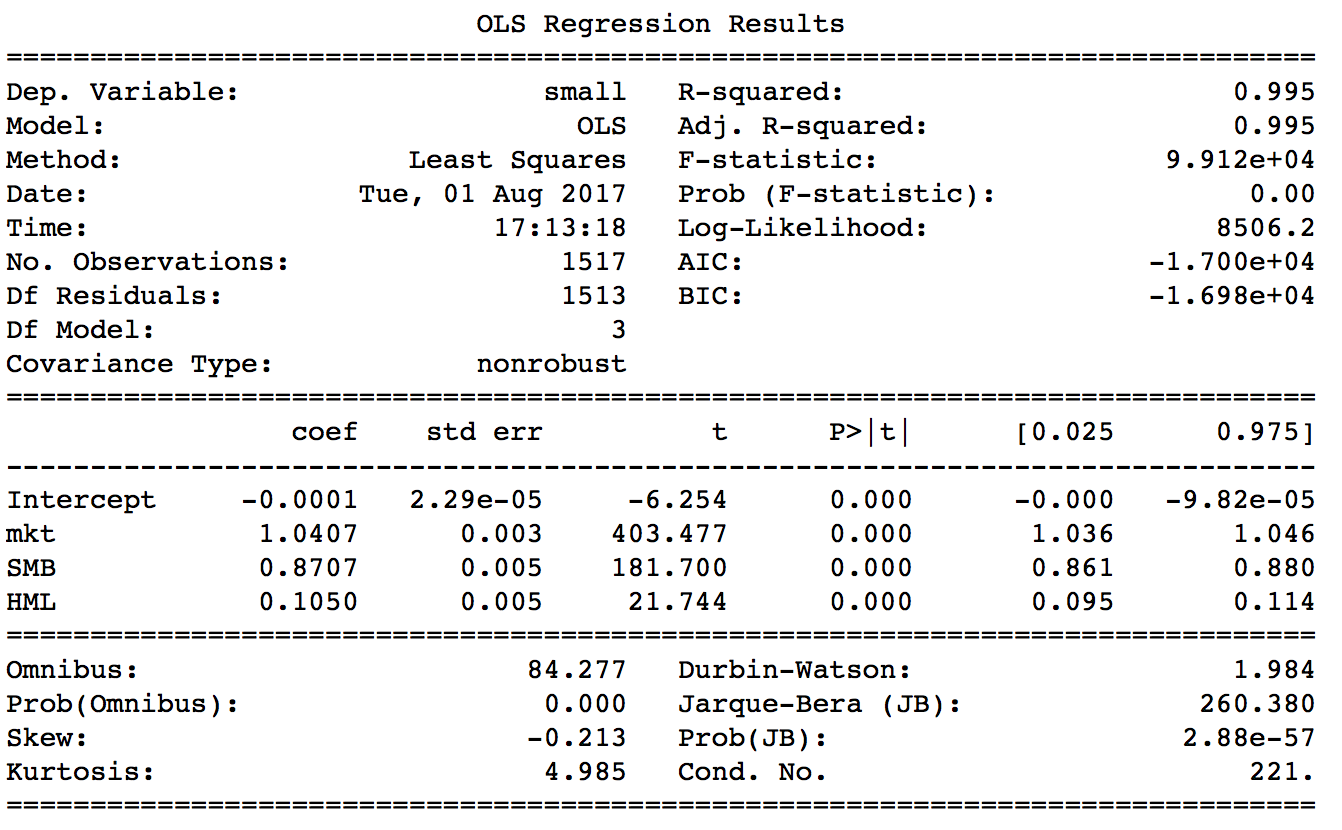
The coefficient of SMB is positive, so when small caps outperform large caps, the Small Cap Index will have higher returns, which is not surprising. By comparing the t statistics of those factors, we know that MKT and SMB are more important factors driving the Small Cap Index.
Results for US Large Cap returns:

As expected, the coefficient of SMB is negative for the Large Cap Index. The coefficient of HML is quite low, which suggests that value and growth stocks take approximately the same weight in the Large Cap Index.
Factor Returns
The Fama-French 5-Factor model comprises two more factors:
- RMW (Robust Minus Weak) measures the excess returns of firms with high operating profit margins over those with lower profits.
- CMA (Conservative Minus Aggressive) measures the excess returns of firms investing less over those investing more.
RMW was proposed by Novy-Marx (2013) who wrote that: "Controlling for gross profitability explains most earnings related anomalies, and a wide range of seemingly unrelated profitable trading strategies." CMA was proposed by Fama and French (2014). The article pointed out that: "A five-factor model directed at capturing the size, value, profitability, and investment patterns in average stock returns is rejected on the GRS test, but for applied purposes it provides an acceptable description of average returns." Finally, momentum is another commonly used factor. It captures excess returns of stocks with highest returns over those with lowest returns
Summary
In this chapter we expand Capital Asset Pricing Model (CAPM) into multi-factor models: the Fama-French factor models in particular. They are the most empirically successful multi-factor models by far, and are commonly used in practice.
Algorithm
Multi-factor strategies are stock picking strategies. Here we try to implement a 2013 paper published by AQR Capital Management.
The paper recommends picking stocks by their value, quality (profitability) and momentum.
The empirically successful measure of value is book-to-price ratio (B/P), but other measures can be used simultaneously to form a more robust and reliable view of a stock's value. The paper uses 5 measures: book-to-price, earnings-to-price ratio (EPS), forecasted EPS, cash flow-to-enterprise value and sales-to-enterprise value.
The paper suggested a few quality measures: total profit over assets, gross margin and free cash flow over assets. There are also various measures of momentum. 1-year momentum, fundamental momentum and returns around earnings announcement are good choices.
In our backtested strategy, we used operating profit margin to measure quality, book value per share to measure value, and 1-month momentum. The portfolio was rebalanced every month. You can build your own version by changing the factor, the weight of each factor, and the rebalance period based on the backtested strategy.
Reference
- mba.tuck.dartmouth.edu/pages/faculty/ken.french/Data_Library/f-f_factors.html
- AQR (2013). A New Core Equity Paradigm: Using Value, Momentum, and Quality to Outperform Markets. Retrieved from www.aqr.com/~/media/files/papers/aqr-a-new-core-equity-paradigm.pdf
- Robert Novy-Marx (2013). The Other Side of Value: The Gross Profitability Premium Journal of Financial Economics 108 (1), 1-28. Retrieved from rnm.simon.rochester.edu/research/OSoV.pdf
- Fama, E F; French, K R (2015). A Five-Factor Asset Pricing Model. 116: 1–22. doi:10.1016/j.jfineco.2014.10.010. Retrieved from www8.gsb.columbia.edu/programs/sites/programs/files/finance/Finance%20Seminar/spring%202014/ken%20french.pdf
- Robert Novy-Marx (2013). The Other Side of Value: The Gross Profitability Premium Journal of Financial Economics 108 (1), 1-28. Retrieved from rnm.simon.rochester.edu/research/OSoV.pdf
- Fama, E. F. & French, K. R. (1993). Common risk factors in the returns on stocks and bonds. Journal of Financial Economics, 33, 3-56. doi: 10.1016/0304-405X(93)90023-5. Retrieved from rady.ucsd.edu.
ON THIS PAGE
Share


QuantConnect™ 2022. All Rights Reserved