Supported Indicators
Correlation
Introduction
The Correlation Indicator is a valuable tool in technical analysis, designed to quantify the degree of relationship between the price movements of a target security (e.g., a stock or ETF) and a reference market index. It measures how closely the target’s price changes are aligned with the fluctuations of the index over a specific period of time, providing insights into the target’s susceptibility to market movements. A positive correlation indicates that the target tends to move in the same direction as the market index, while a negative correlation suggests an inverse relationship. A correlation close to 0 implies a weak or no linear relationship. Commonly, the SPX index is employed as the benchmark for the overall market when calculating correlation, ensuring a consistent and reliable reference point. This helps traders and investors make informed decisions regarding the risk and behavior of the target security in relation to market trends.
To view the implementation of this indicator, see the LEAN GitHub repository.
Using C Indicator
To create an automatic indicators for Correlation, call the C helper method from the QCAlgorithm class. The C method creates a Correlation object, hooks it up for automatic updates, and returns it so you can used it in your algorithm. In most cases, you should call the helper method in the Initializeinitialize method.
public class CorrelationAlgorithm : QCAlgorithm
{
    private Symbol _symbol;
    private Symbol _reference;
    private Correlation _c;

    public override void Initialize()
    {
        _symbol = AddEquity("SPY", Resolution.Daily).Symbol;
        _reference = AddEquity("QQQ", Resolution.Daily).Symbol;
        _c = C(_symbol, reference, 20, correlationType=CorrelationType.Pearson);
    }

    public override void OnData(Slice data)
    {
        if (_c.IsReady)
        {
            // The current value of _c is represented by itself (_c)
            // or _c.Current.Value
            Plot("Correlation", "c", _c);

        }
    }
}
class CorrelationAlgorithm(QCAlgorithm):
def Initialize(self) -> None:
self._symbol = self.AddEquity("SPY", Resolution.Daily).Symbol
self.reference = self.AddEquity("QQQ", Resolution.Daily).Symbol
self.c = self.C(self.symbol, reference, 20, correlationType=CorrelationType.Pearson)
def on_data(self, slice: Slice) -> None:
if self.c.IsReady:
# The current value of self.c is represented by self.c.Current.Value
self.plot("Correlation", "c", self.c.Current.Value)
The following reference table describes the C method:
C()1/1
            Correlation QuantConnect.Algorithm.QCAlgorithm.C (
    Symbol                                target,
    Symbol                                reference,
    Int32                                 period,
    *CorrelationType                      correlationType,
    *Nullable<Resolution>           resolution,
    *Func<IBaseData, IBaseDataBar>  selector
   )
Creates a Correlation indicator for the given target symbol in relation with the reference used. The indicator will be automatically updated on the given resolution.
If you don't provide a resolution, it defaults to the security resolution. If you provide a resolution, it must be greater than or equal to the resolution of the security. For instance, if you subscribe to hourly data for a security, you should update its indicator with data that spans 1 hour or longer.
For more information about the selector argument, see Alternative Price Fields.
For more information about plotting indicators, see Plotting Indicators.
You can manually create a Correlation indicator, so it doesn't automatically update. Manual indicators let you update their values with any data you choose.
Updating your indicator manually enables you to control when the indicator is updated and what data you use to update it. To manually update the indicator, call the Updateupdate method with a TradeBar or QuoteBar. The indicator will only be ready after you prime it with enough data.
public class CorrelationAlgorithm : QCAlgorithm
{
    private Symbol _symbol;
    private Symbol _reference;
    private Correlation _c;

    public override void Initialize()
    {
        _symbol = AddEquity("SPY", Resolution.Daily).Symbol;
        _reference = AddEquity("QQQ", Resolution.Daily).Symbol;
        _c = new Correlation("", _symbol, reference, 20, correlationType=CorrelationType.Pearson);
    }

    public override void OnData(Slice data)
    {
        if (data.Bars.TryGetValue(_symbol, out var bar))
        {
            _c.Update(bar);
        }
        if (data.Bars.TryGetValue(_reference, out bar))
        {
            _c.Update(bar);
        }

        if (_c.IsReady)
        {
            // The current value of _c is represented by itself (_c)
            // or _c.Current.Value
            Plot("Correlation", "c", _c);

        }
    }
}
class CorrelationAlgorithm(QCAlgorithm):
def Initialize(self) -> None:
self._symbol = self.AddEquity("SPY", Resolution.Daily).Symbol
self.reference = self.AddEquity("QQQ", Resolution.Daily).Symbol
self.c = Correlation("", self.symbol, reference, 20, correlationType=CorrelationType.Pearson)
def on_data(self, slice: Slice) -> None:
bar = slice.Bars.get(self.symbol)
if bar:
self.c.Update(bar)
bar = slice.Bars.get(self.referece)
if bar:
self.c.Update(bar)
if self.c.IsReady:
# The current value of self.c is represented by self.c.Current.Value
self.plot("Correlation", "c", self.c.Current.Value)
To register a manual indicator for automatic updates with the security data, call the RegisterIndicator method.
public class CorrelationAlgorithm : QCAlgorithm
{
    private Symbol _symbol;
    private Symbol _reference;
    private Correlation _c;

    public override void Initialize()
    {
        _symbol = AddEquity("SPY", Resolution.Daily).Symbol;
        _reference = AddEquity("QQQ", Resolution.Daily).Symbol;
        _c = new Correlation("", _symbol, reference, 20, correlationType=CorrelationType.Pearson);
        RegisterIndicator(_symbol, _c, Resolution.Daily);
        RegisterIndicator(reference, _c, Resolution.Daily);
    }

    public override void OnData(Slice data)
    {
        if (_c.IsReady)
        {
            // The current value of _c is represented by itself (_c)
            // or _c.Current.Value
            Plot("Correlation", "c", _c);

        }
    }
}
class CorrelationAlgorithm(QCAlgorithm):
def Initialize(self) -> None:
self._symbol = self.AddEquity("SPY", Resolution.Daily).Symbol
self.reference = self.AddEquity("QQQ", Resolution.Daily).Symbol
self.c = Correlation("", self.symbol, reference, 20, correlationType=CorrelationType.Pearson)
self.RegisterIndicator(self.symbol, self.c, Resolution.Daily)
self.RegisterIndicator(reference, self.c, Resolution.Daily)
def on_data(self, slice: Slice) -> None:
if self.c.IsReady:
# The current value of self.c is represented by self.c.Current.Value
self.plot("Correlation", "c", self.c.Current.Value)
The following reference table describes the Correlation constructor:
Correlation()1/2
            Correlation QuantConnect.Indicators.Correlation (
    string            name,
    Symbol            targetSymbol,
    int               period,
    Symbol            referenceSymbol,
    *CorrelationType  correlationType
   )
and period values.
Correlation()2/2
            Correlation QuantConnect.Indicators.Correlation (
    Symbol            targetSymbol,
    int               period,
    Symbol            referenceSymbol,
    *CorrelationType  correlationType
   )
and period values.
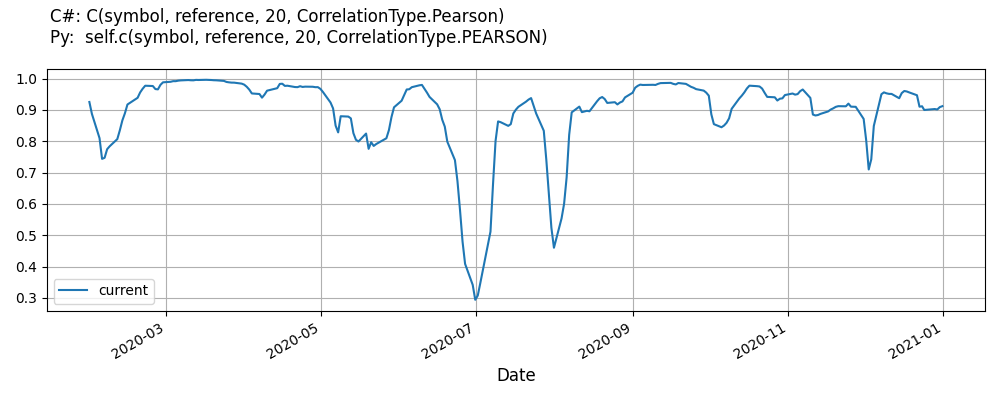
Visualization
The following image shows plot values of selected properties of Correlation using the plotly library.
You can also see our Videos. You can also get in touch with us via Discord.
Did you find this page helpful?