Supported Indicators
Williams Percent R
Introduction
Williams %R, or just %R, is the current closing price in relation to the high and low of the past N days (for a given N). The value of this indicator fluctuates between -100 and 0. The symbol is said to be oversold when the oscillator is below -80%, and overbought when the oscillator is above -20%.
To view the implementation of this indicator, see the LEAN GitHub repository.
Using WILR Indicator
To create an automatic indicators for WilliamsPercentR, call the WILR helper method from the QCAlgorithm class. The WILR method creates a WilliamsPercentR object, hooks it up for automatic updates, and returns it so you can used it in your algorithm. In most cases, you should call the helper method in the Initializeinitialize method.
public class WilliamsPercentRAlgorithm : QCAlgorithm
{
    private Symbol _symbol;
    private WilliamsPercentR _wilr;

    public override void Initialize()
    {
        _symbol = AddEquity("SPY", Resolution.Daily).Symbol;
        _wilr = WILR(_symbol, 20);
    }

    public override void OnData(Slice data)
    {
        if (_wilr.IsReady)
        {
            // The current value of _wilr is represented by itself (_wilr)
            // or _wilr.Current.Value
            Plot("WilliamsPercentR", "wilr", _wilr);
            // Plot all properties of wilr
            Plot("WilliamsPercentR", "maximum", _wilr.Maximum);
            Plot("WilliamsPercentR", "minimum", _wilr.Minimum);
        }
    }
}
class WilliamsPercentRAlgorithm(QCAlgorithm):
def Initialize(self) -> None:
self._symbol = self.AddEquity("SPY", Resolution.Daily).Symbol
self.wilr = self.WILR(self.symbol, 20)
def on_data(self, slice: Slice) -> None:
if self.wilr.IsReady:
# The current value of self.wilr is represented by self.wilr.Current.Value
self.plot("WilliamsPercentR", "wilr", self.wilr.Current.Value)
# Plot all attributes of self.wilr
self.plot("WilliamsPercentR", "maximum", self.wilr.Maximum.Current.Value)
self.plot("WilliamsPercentR", "minimum", self.wilr.Minimum.Current.Value)
The following reference table describes the WILR method:
WILR()1/1
            WilliamsPercentR QuantConnect.Algorithm.QCAlgorithm.WILR (
    Symbol                                symbol,
    Int32                                 period,
    *Nullable<Resolution>           resolution,
    *Func<IBaseData, IBaseDataBar>  selector
   )
Creates a new Williams %R indicator. This will compute the percentage change of the current closing price in relation to the high and low of the past N periods. The indicator will be automatically updated on the given resolution.
If you don't provide a resolution, it defaults to the security resolution. If you provide a resolution, it must be greater than or equal to the resolution of the security. For instance, if you subscribe to hourly data for a security, you should update its indicator with data that spans 1 hour or longer.
For more information about the selector argument, see Alternative Price Fields.
For more information about plotting indicators, see Plotting Indicators.
You can manually create a WilliamsPercentR indicator, so it doesn't automatically update. Manual indicators let you update their values with any data you choose.
Updating your indicator manually enables you to control when the indicator is updated and what data you use to update it. To manually update the indicator, call the Updateupdate method with a TradeBar or QuoteBar. The indicator will only be ready after you prime it with enough data.
public class WilliamsPercentRAlgorithm : QCAlgorithm
{
    private Symbol _symbol;
    private WilliamsPercentR _wilr;

    public override void Initialize()
    {
        _symbol = AddEquity("SPY", Resolution.Daily).Symbol;
        _wilr = new WilliamsPercentR(20);
    }

    public override void OnData(Slice data)
    {
        if (data.Bars.TryGetValue(_symbol, out var bar))
        {
            _wilr.Update(bar);
        }

        if (_wilr.IsReady)
        {
            // The current value of _wilr is represented by itself (_wilr)
            // or _wilr.Current.Value
            Plot("WilliamsPercentR", "wilr", _wilr);
            // Plot all properties of wilr
            Plot("WilliamsPercentR", "maximum", _wilr.Maximum);
            Plot("WilliamsPercentR", "minimum", _wilr.Minimum);
        }
    }
}
class WilliamsPercentRAlgorithm(QCAlgorithm):
def Initialize(self) -> None:
self._symbol = self.AddEquity("SPY", Resolution.Daily).Symbol
self.wilr = WilliamsPercentR(20)
def on_data(self, slice: Slice) -> None:
bar = slice.Bars.get(self.symbol)
if bar:
self.wilr.Update(bar)
if self.wilr.IsReady:
# The current value of self.wilr is represented by self.wilr.Current.Value
self.plot("WilliamsPercentR", "wilr", self.wilr.Current.Value)
# Plot all attributes of self.wilr
self.plot("WilliamsPercentR", "maximum", self.wilr.Maximum.Current.Value)
self.plot("WilliamsPercentR", "minimum", self.wilr.Minimum.Current.Value)
To register a manual indicator for automatic updates with the security data, call the RegisterIndicator method.
public class WilliamsPercentRAlgorithm : QCAlgorithm
{
    private Symbol _symbol;
    private WilliamsPercentR _wilr;

    public override void Initialize()
    {
        _symbol = AddEquity("SPY", Resolution.Daily).Symbol;
        _wilr = new WilliamsPercentR(20);
        RegisterIndicator(_symbol, _wilr, Resolution.Daily);
    }

    public override void OnData(Slice data)
    {
        if (_wilr.IsReady)
        {
            // The current value of _wilr is represented by itself (_wilr)
            // or _wilr.Current.Value
            Plot("WilliamsPercentR", "wilr", _wilr);
            // Plot all properties of wilr
            Plot("WilliamsPercentR", "maximum", _wilr.Maximum);
            Plot("WilliamsPercentR", "minimum", _wilr.Minimum);
        }
    }
}
class WilliamsPercentRAlgorithm(QCAlgorithm):
def Initialize(self) -> None:
self._symbol = self.AddEquity("SPY", Resolution.Daily).Symbol
self.wilr = WilliamsPercentR(20)
self.RegisterIndicator(self.symbol, self.wilr, Resolution.Daily)
def on_data(self, slice: Slice) -> None:
if self.wilr.IsReady:
# The current value of self.wilr is represented by self.wilr.Current.Value
self.plot("WilliamsPercentR", "wilr", self.wilr.Current.Value)
# Plot all attributes of self.wilr
self.plot("WilliamsPercentR", "maximum", self.wilr.Maximum.Current.Value)
self.plot("WilliamsPercentR", "minimum", self.wilr.Minimum.Current.Value)
The following reference table describes the WilliamsPercentR constructor:
WilliamsPercentR()1/2
            WilliamsPercentR QuantConnect.Indicators.WilliamsPercentR (
    int  period
   )
Creates a new Williams %R.
WilliamsPercentR()2/2
            WilliamsPercentR QuantConnect.Indicators.WilliamsPercentR (
    string  name,
    int     period
   )
Creates a new Williams %R.
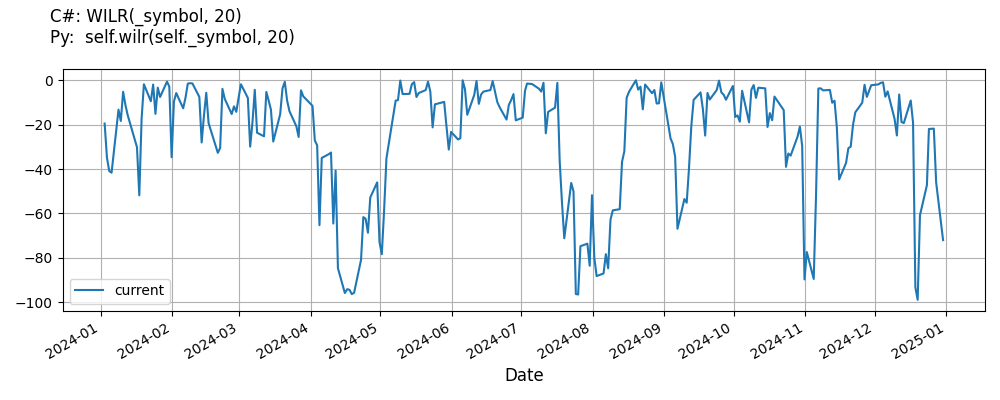
Visualization
The following image shows plot values of selected properties of WilliamsPercentR using the plotly library.
You can also see our Videos. You can also get in touch with us via Discord.
Did you find this page helpful?