Using the QuantConnect Charting API
We’re pleased to announce the release of a new charting API which lets you create flexible, dynamic charts from your backtest. The charts stream to your browser as the backtest is running and can be configured in many different ways. It is a very simple API, allowing you to create custom charts with just 1 line of code. The minimal usage plots a second line on your strategy’s equity chart. It can be accessed like this:
//Minimum code required for custom plotting:
Plot(string seriesName, decimal/int/float value);
//Example using the 'Strategy Equity' chart by default.
Plot("Portfolio", Portfolio.TotalPortfolioValue);

Custom line plot stacked with your strategy equity.
With just one extra parameter, the chart name, you can also create your own chart and place any series onto it you wish:
//Create your own charts by specifying a chart name:
Plot(string chartName, string seriesName, decimal/int/float value);
Underneath the Plot() function are two key classes: Chart and Series. The Chart class is the canvas you’d like to draw on, it can be set so the Series are Stacked or Overlayed. The Series classes are the data on the chart, they default to Line plots but can be set to be Candles or Scatter. Below is an example of creating a customized chart and plotting our trades on top of the asset price:
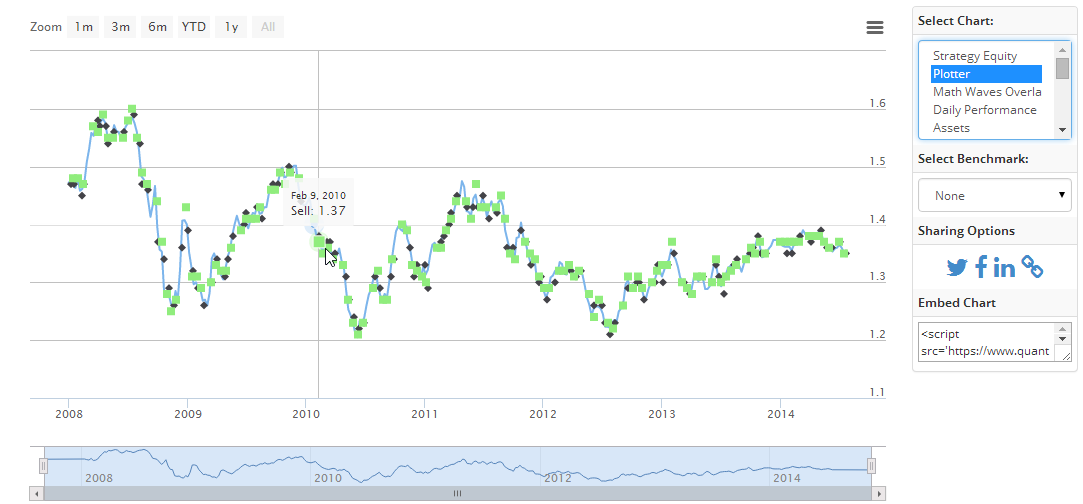
Plot prices with trades to see where your algorithm is working.
//Our custom chart, id: "Currency Plotter", Overlay the series.
Chart plotter = new Chart("Currency Plotter", ChartType.Overlay);
//Line series for our EURUSD pricing.
plotter.AddSeries(new Series("EURUSD", SeriesType.Line));
//Scatter-series for our BUY-orders.
plotter.AddSeries(new Series("Buy", SeriesType.Scatter));
//Scatter-series for our SELL-orders
plotter.AddSeries(new Series("Sell", SeriesType.Scatter));
AddChart(plotter); //Add the Chart to our algorithm
Once you’ve setup your custom chart you can access it with the Plot() function.
Plot("Currency Plotter", "EURUSD", price);      // Save End of Day prices.
Plot("Currency Plotter", "Buy", purchasePrice); // Plot purchasing prices.
Plot("Currency Plotter", "Sell", salePrice);    // Plot sale prices.
The SeriesType enum controls the style of a series. Data passed into candle plots gets automatically converted into Daily or Weekly candles depending on the quantity of data. Because of technical limitations of working in a browser all series are capped at 4000 samples. If you find your browser slowing down try sampling less!
Class Chart(string chartName, ChartType type);
Class Series(string seriesName, SeriesType type);
Enum ChartType { Overlay, Stacked }
Enum SeriesType { Line, Scatter, Candle }
Putting it all together the results are fairly exciting, we hope you’ll enjoy! To get you started we’ve made a demonstration algorithm which generates the charts below. Clone it and copy the bits you like into your algorithm.
[slideshow_deploy id=’920′]
By: Jared Broad
Founder & CEO
26.07.2014 Back to Blog
Related Articles
algorithmic tradingNew Machine Learning Package: MlFinLab
By: Jared Broad • 17.10.2022 algorithmic trading By: Jared Broad • 20.09.2022 crowdfunding By: Jared Broad • 08.09.2022 algorithmic trading By: Jared Broad • 13.07.2022New Low-Latency FIX Integration to Atreyu
By: Carey • 26.10.2021