


At QuantConnect, we provide institutional-grade trading infrastructure and data for quants to develop and deploy algorithmic trading strategies. Once deployed, the quants can then license their proprietary signals to investors through our Alpha Streams platform. With the live equity curves of the alphas listed in our Alpha Market recently being made freely available for download, investors can perform deeper analysis on an alpha’s true out-of-sample performance before subscribing to its live trading signals.
To assist investors with their alpha research, we’ve released a new QC notebook. Using the live equity curves of a collection of alphas, this notebook determines the optimal portfolio weights for each alpha so that the portfolio’s Sortino ratio is maximized.
Our Process:
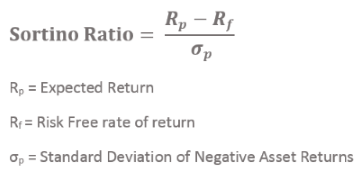
We sought to use the Sortino ratio as the factor to maximize through the optimization process. The Sortino ratio is a popular metric for analyzing the performance of a trading strategy. It’s a measure of the strategy’s average daily return in excess of some risk-free rate, divided by the standard deviation of the strategy’s negative daily returns. In symbols, the Sortino ratio is defined as
We encourage alpha investors to spread their capital across several Alpha Streams algorithms instead of concentrating their resources into just one or two. As pointed out by Steward and Masters, “provided the assets are not highly correlated, a diversified portfolio should reduce the overall volatility of returns and smooth investment returns over the long term” (2019). Or, as said best by Nobel Prize laureate Harry Markowitz, “diversification is the only free lunch in investing.”
To avoid selection bias or look-ahead bias in the Alpha Streams Portfolio Optimization notebook, a walk-forward approach is taken to selecting the alpha allocations. This means that when the portfolio of alphas is rebalanced, only the trailing equity curves of each alpha are used to determine the optimal portfolio weights. To reduce the risk of overfitting, the notebook only has one parameter: the lookback period to use when calculating the Sortino ratio.
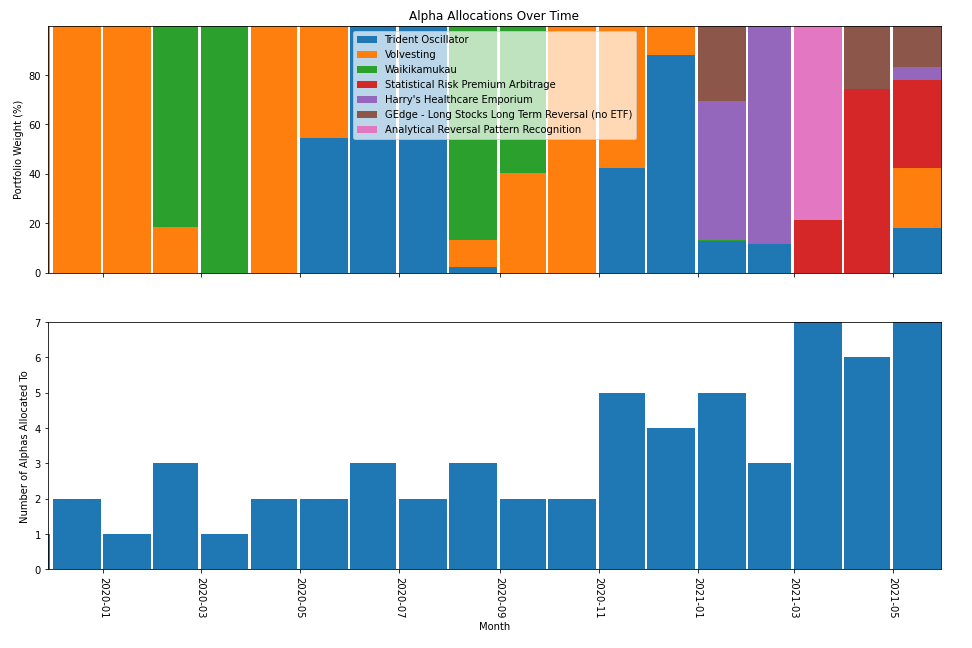
The walk-forward optimization is done on a rolling monthly basis. At the start of each month, the optimizer determines which portfolio weights to use for the upcoming month. There are no restrictive constraints applied to the optimization process, so the weight for each alpha can range from 0 to 100% of the portfolio. We chose not to include constraints on the portfolio weight for each alpha so that the optimizer would be free to select the optimal weights without any restrictions, even if that means allocating 100% of the portfolio to a single alpha. To ensure the portfolio remains invested at all times, it is fixed to allocate 100% of its capital among the alphas during each rebalance. Once the portfolio weights are selected by the optimizer, the weights aren’t adjusted until the next rebalancing.
To visualize the result of each rebalance, the notebook creates the two bar plots that are shown below. The top plot shows the portfolio weight for each alpha during each rebalance. The bottom plot displays the number of different alphas allocated to during each rebalance.
To determine the optimal portfolio weights that maximize the portfolio’s Sortino ratio, the notebook uses the SciPy library. The SciPy optimizer works by passing a collection of different weights to an objective function that we define. In this notebook, the objective function combines the weights with the trailing equity curves of the alphas to produce a portfolio equity curve. The objective function then returns the Sortino ratio of this portfolio equity curve. After numerous tests, SciPy automatically selects the portfolio weights that have maximized the portfolio’s Sortino ratio.
The objective function in the notebook can be adjusted to maximize any portfolio factor. In the factors.py file, there are definitions for the Sortino ratio, Beta, and max drawdown factors, and more can be added. In an earlier version of this notebook, a combination of these three factors was used to define the objective function. However, for simplicity and to ensure the resulting portfolio focuses on maximizing return while minimizing downside risk, the notebook shared below only uses the Sortino ratio factor in the objective function.
Results
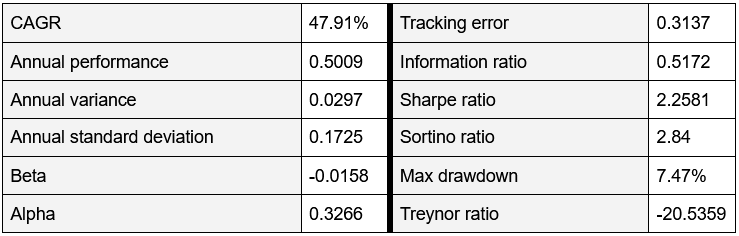
Once the optimal portfolio weights are found for each month in the simulation, the notebook can compute the equity curve of holding the optimized portfolio of alphas. With the portfolio equity curve available, the notebook is able to calculate several performance statistics. These statistics include the following:
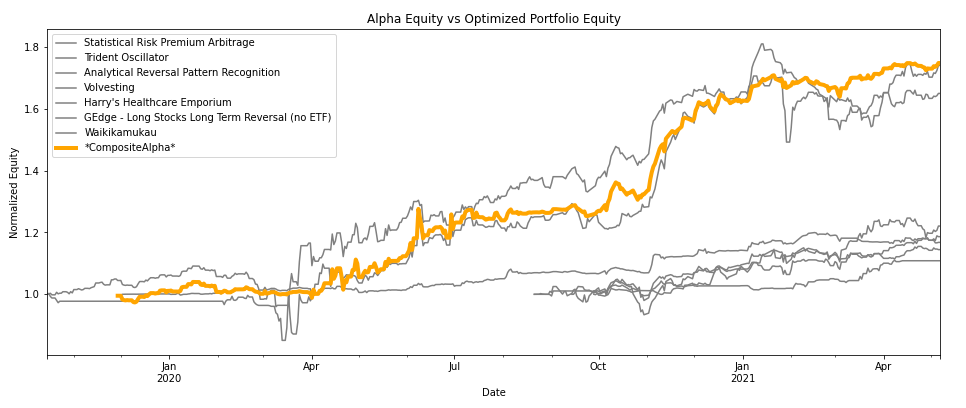
In addition to displaying these statistics, the notebook also includes a method to plot the equity curves of the alphas along with the optimized equity curve of the Alpha Streams portfolio so investors can gauge relative performance.
A video demonstration of the notebook is presented below.
To clone the notebook and begin researching alphas, visit this forum thread.


Derek Melchin
The material on this website is provided for informational purposes only and does not constitute an offer to sell, a solicitation to buy, or a recommendation or endorsement for any security or strategy, nor does it constitute an offer to provide investment advisory services by QuantConnect. In addition, the material offers no opinion with respect to the suitability of any security or specific investment. QuantConnect makes no guarantees as to the accuracy or completeness of the views expressed in the website. The views are subject to change, and may have become unreliable for various reasons, including changes in market conditions or economic circumstances. All investments involve risk, including loss of principal. You should consult with an investment professional before making any investment decisions.
To unlock posting to the community forums please complete at least 30% of Boot Camp.
You can continue your Boot Camp training progress from the terminal. We hope to see you in the community soon!