


 Share New Research


Introduction
Trend rules have a long record of cutting drawdowns in risky assets, and Bitcoin has become one of the fastest-moving gauges of global risk appetite. Building on both observations, this strategy holds the Invesco QQQ Trust (QQQ) only while Bitcoin trades above its 50-day average with positive 20-day momentum. Whenever either condition fails, it rotates into the iShares 1-3 Year Treasury Bond ETF (SHY). The algorithm trades these two US Equity ETFs but makes its trading decisions based purely on Bitcoin's price movements. The results show that from January 2014 to August 2026, the strategy earned greater risk-adjusted returns than buy-and-hold positions in both the SPY and QQQ.
Background
Faber (2007) shows that holding a risky asset only while its price sits above a long moving average has historically preserved most of the asset's return while avoiding the deepest drawdowns. Liu and Tsyvinski (2021) find that Bitcoin returns exhibit strong time series momentum, so the sign of Bitcoin's own recent return also carries information about what comes next. The two Bitcoin conditions in this strategy are precisely these signals, a trend-level test against the 50-day average and a momentum-sign test on the 20-day rate of change.
The distinctive choice in this strategy is reading those signals from Bitcoin while trading the Nasdaq. Bitcoin trades around the clock with no halts, circuit breakers, or closing bell, and a heavily leveraged derivatives market amplifies its reactions, so shifts in risk appetite show up in its price quickly. Growth Equities respond to the same swings in risk appetite and liquidity. Iyer (2022) estimates that since 2020, spillovers from Bitcoin explain roughly 14 to 18% of the variation in Equity price volatility across major global markets, with the S&P 500 near 17%. The premise of the strategy is that a sustained Bitcoin downtrend flags deteriorating risk conditions before they fully work through the Equity market, so stepping out of QQQ at that point trades away some upside for protection during risk-off cascades.
The trading rule in this strategy is to hold QQQ when Bitcoin is trading above its 50-day simple moving average and its 20-day return is positive. Otherwise, it flees to SHY for safety. To reduce churn, the algorithm only evaluates the trading rule at the start of each week. This kind of gate is aimed at reducing risk rather than increasing returns, so the honest benchmark question is whether it improves risk-adjusted performance over simply holding QQQ, not whether it outruns QQQ in a bull market.
Implementation
To implement this strategy, we start by adding the two Equity ETFs we'll trade in the initialize method.
qqq = self.add_equity("QQQ", Resolution.DAILY)
shy = self.add_equity("SHY", Resolution.DAILY)
Next, we'll add the BTCUSD pair and the two indicators we'll need to classify the current market regime, a 50-day simple moving average and a 20-day rate of change.
btc = self.add_crypto("BTCUSD", Resolution.DAILY, Market.BITFINEX)
self.settings.automatic_indicator_warm_up = True
btc.sma = self.sma(btc, 50)
btc.roc = self.roc(btc, 20)
Lastly, we add a Scheduled Event that runs at 8 AM Eastern Time (ET) on the first trading day of each week before the regular trading session of the US Equity markets. When Bitcoin trades above its average with positive momentum, the algorithm moves the portfolio into QQQ. Otherwise, it moves the portfolio into SHY.
# Rebalance the portfolio at the start of each week.
self.schedule.on(
    self.date_rules.week_start(qqq),
    self.time_rules.at(8, 0),
    # Trading rule: When BTCUSD is rising, hold QQQ. Otherwise, hold SHY.
    lambda: self.set_holdings(qqq if btc.price > btc.sma.current.value and btc.roc.current.value > 0 else shy, 1, True)
)
Results
We backtested the strategy from January 2014 to August 2026, which equals about 3 Bitcoin epochs. Over that period, the strategy earned a 0.838 Sharpe ratio. In contrast, a buy-and-hold position over the same time period achieved a 0.564 Sharpe ratio in the SPY and a 0.682 Sharpe ratio in the QQQ. Therefore, the strategy outperformed the benchmarks.
We ran a parameter optimization job to test the sensitivity of the chosen parameters. We tested the length of Bitcoin's simple moving average period from 30 to 70 days in steps of 10, and we tested the rate of change period from 10 to 30 days in steps of 5. Of the 25 parameter combinations, 25/25 (100%) produced a greater Sharpe ratio than the SPY benchmark and 23/25 (92%) produced a greater Sharpe ratio than the QQQ benchmark. The following image shows the heatmap of Sharpe ratios for the parameter combinations:
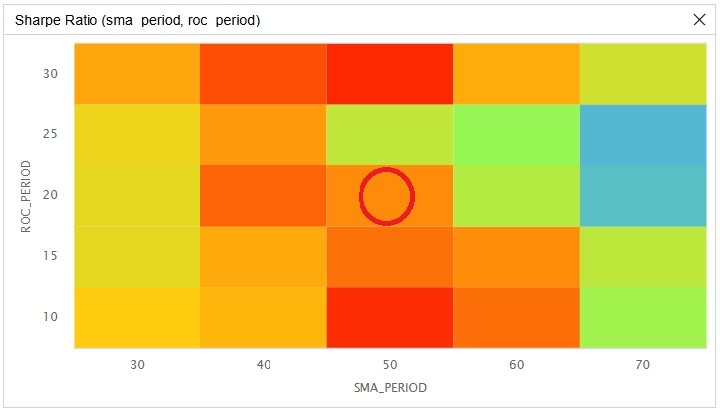
The red circle in the preceding image identifies the parameters we chose as the strategy's default. We chose a 50-day moving average and a 20-day rate of change because the combination sits at the center of mass of the heatmap. This default parameter combination earned a 0.838 Sharpe ratio, above the grid's median of 0.812.
The strongest cells sit in the interior of the simple moving average axis, at 40 and 50 days, and Sharpe ratios decline steadily toward the 70-day edge in every rate of change row, reaching the grid's lowest values (0.629 to 0.76) in the 70-day column. A plausible explanation is that a longer average responds more slowly to turns in Bitcoin's trend, so the gate exits declines and re-enters recoveries with more delay. Along the rate of change axis, the highest values at the 50-day average sit at both ends of the tested range, 0.895 at 10 days and 0.898 at 30 days, with a trough of 0.747 at 25 days. Even so, every cell in that column earns a higher Sharpe ratio than both benchmarks, so the rate of change period changes the size of the edge rather than its existence. Differences of this size are well within the estimation uncertainty of a Sharpe ratio measured over a 12.6-year sample, so we keep the 20-day default rather than tune toward the edges. The strongest tested combination also lies on the 30-day boundary, so the range of the grid may not contain the global optimum.
Every tested combination beat buy-and-hold SPY on Sharpe ratio in this sample, and 23 of the 25 also beat buy-and-hold QQQ, so the gate's risk-adjusted edge did not hinge on the specific periods chosen. The main residual risk is a Crypto-specific shock, such as an exchange failure or a regulatory crackdown. A shock like this drives Bitcoin into a downtrend while Equities stay healthy, pulling the portfolio out of QQQ for reasons unrelated to Equity risk. Future research could extend the range of rate of change periods beyond 30 days or apply the same Bitcoin gate to other high-beta ETFs such as semiconductor or small-cap growth funds.
References
- Faber, M. T. (2007). A Quantitative Approach to Tactical Asset Allocation. The Journal of Wealth Management, 9(4), 69-79. Available at SSRN 962461.
- Iyer, T. (2022). Cryptic Connections: Spillovers between Crypto and Equity Markets. IMF Global Financial Stability Notes 2022/001.
- Liu, Y., & Tsyvinski, A. (2021). Risks and Returns of Cryptocurrency. The Review of Financial Studies, 34(6), 2689-2727. Available at NBER w24877.


Derek Melchin
The material on this website is provided for informational purposes only and does not constitute an offer to sell, a solicitation to buy, or a recommendation or endorsement for any security or strategy, nor does it constitute an offer to provide investment advisory services by QuantConnect. In addition, the material offers no opinion with respect to the suitability of any security or specific investment. QuantConnect makes no guarantees as to the accuracy or completeness of the views expressed in the website. The views are subject to change, and may have become unreliable for various reasons, including changes in market conditions or economic circumstances. All investments involve risk, including loss of principal. You should consult with an investment professional before making any investment decisions.
To unlock posting to the community forums please complete at least 30% of Boot Camp.
You can continue your Boot Camp training progress from the terminal. We hope to see you in the community soon!