


 Share New Research


I tested a simple intraday idea on the Nasdaq-100 and want to share the full path, including the part that did not work. The attached backtest runs the final rule with real orders in E-mini Nasdaq-100 futures from January 2015 to November 2026. The paper and all code are public.
The question
Index futures often open away from the prior close. A common view holds that the gap shows where the day is going. Does the direction of the opening gap carry into the session, and if not, what decides whether a breakout after the open pays?
How I tested it
Before the first run I wrote down the rule family, the measure and the pass criterion. Development used 2020 to November 2026. The years 2015 to 2019 stayed closed as a test sample, and I opened them once, for the final rule only.
- 51 variants in total: 24 gap rules (range length, entry type, stop, break-even), 18 combinations of direction and day filter, 8 stop rules and one data correction. Every variant counts in the deflated Sharpe ratio.
- I compared each rule with the same rule on the same days with a random direction (1,000 runs).
- I built the rules in R on vendor minute data. Then I computed every variant again on QuantConnect, and the final rule also with real orders in Micro Nasdaq-100 futures (MNQ).
The rule that came out
Direction from the first 5-minute candle of QQQ, no trade on a flat candle. Trade only when the volume of the bars 9:31 to 9:34 is at least the average of the previous 14 sessions. Buy stop at the range high or sell stop at the range low, valid until 11:30. Stop at the other side of the range, exit at 15:55. Risk 1% of equity per trade, notional at most 4 times equity.
The rule is close to the one in Zarattini and Aziz (2023, SSRN 4416622). It differs in the stop-order entry and the volume filter.
Results
Real orders on QuantConnect2020 to Nov 2026 (MNQ)2015 to 2019 (NQ)2015 to Nov 2026 (NQ, attached)Return a year16.8%−4.0%8.5%Sharpe ratio (after risk-free rate)0.63−0.330.31Largest loss−16.6%−31.7%−31.7%Trades6494261,073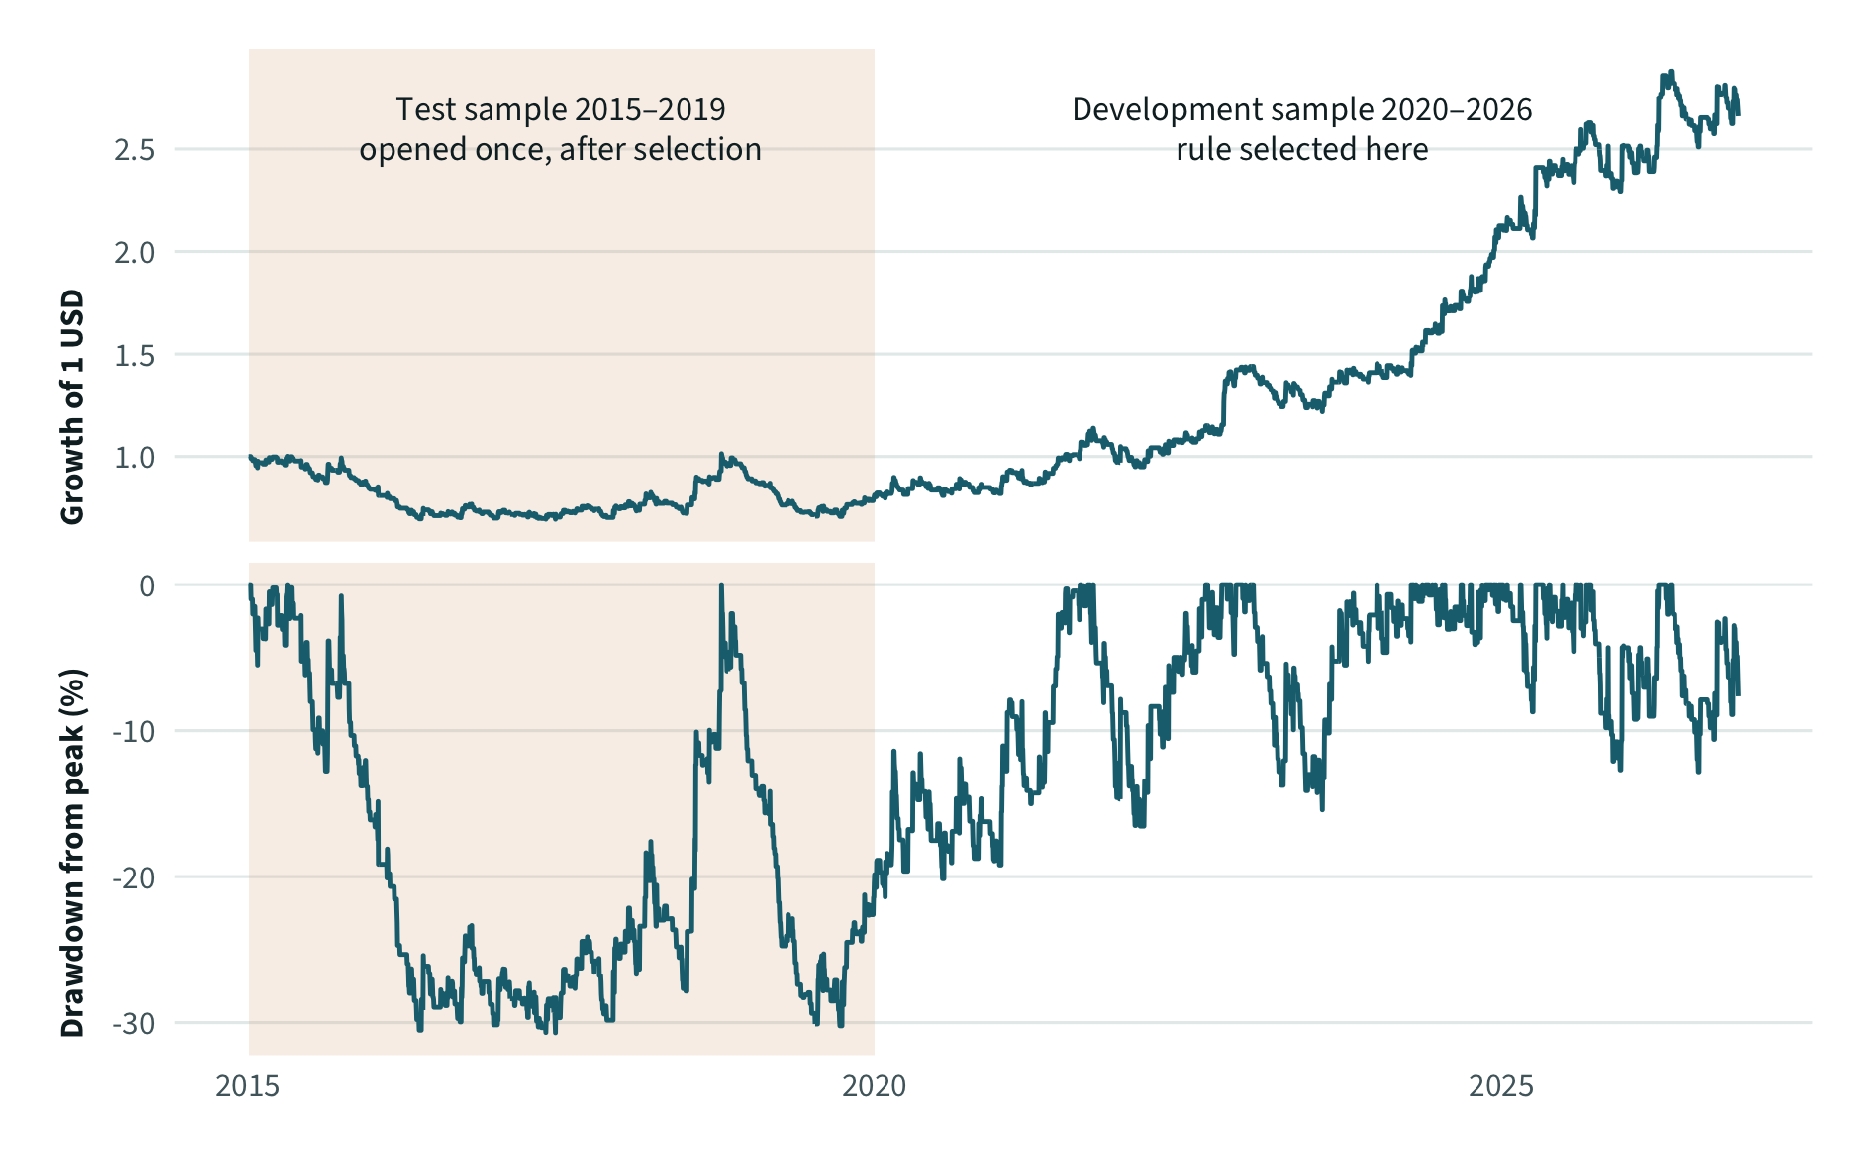
In development the rule beat 99.8% of the random-direction runs, but its deflated Sharpe ratio was 0.83 against a registered hurdle of 0.95. I opened the test sample anyway. There it failed all three registered conditions: Sharpe ratio −0.18 at the trigger price, a mean result per trade of −0.005 R, and better than only 30% of the random runs. Only 2017 and 2018 were positive.
The attached run treats all twelve years as one account. Its two halves match the separate runs. All 426 trades of 2015 to 2019 are identical. Of the 649 MNQ trades of 2020 to 2026, 647 fall on the same days with the same direction.
What decides the result
The gap direction is a weak guide. It beat a random direction in only 4 of 24 gap rules, all of them weak ones. The result depends on the type of day.
I sorted the days by their range after the close. The 24 gap rules lose 27 basis points a day in the quietest fifth and earn 37 in the widest. The range is known only after the close and cannot be traded. The sorting shows where an edge would have to come from.
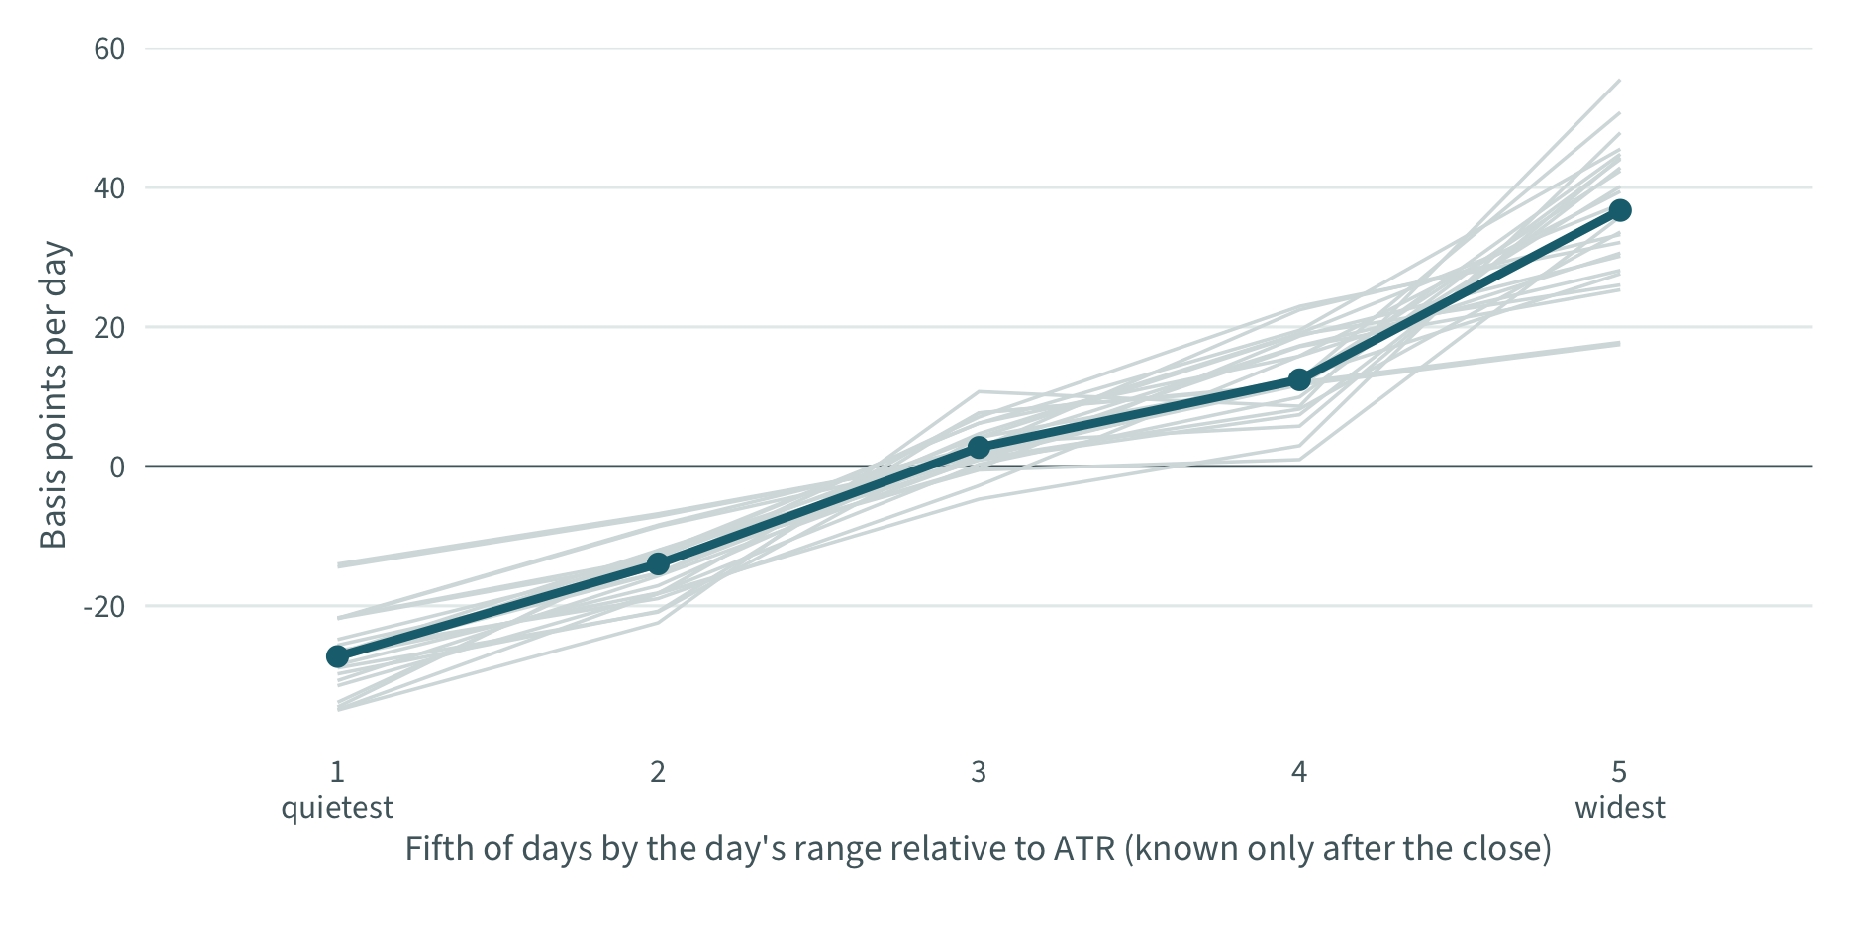
This also explains the concentration. With real orders the ten best trades carry 66% of the total profit, and the median trade is a full loss of 1 R.
What the replication showed
- The fill model. With minute data, QuantConnect fills a stop order at the close of the trigger minute. On a breakout that close is far from the trigger. Slippage was 0.16 R per trade with minute data and 0.04 R with second data.
- The signal source. Futures volume selects other days than QQQ volume. With direction and volume from the future, the same rule lost money (Sharpe ratio −0.31).
- The vendor data. In my research data, the volume of the opening one-minute bar jumped fourfold in March 2025. In May 2026 it fell to a tenth. The bars after it show no break, so the opening auction is probably sometimes included and sometimes not. A volume filter reacts to that as if the market had changed. I now measure volume without the opening bar.
Links
- Paper (PDF, bottom line and key figures): https://ludwigjmarx.com/research/wp1-opening-gap-breakouts
- Code and derived results: https://github.com/LudwigJMarx/quant-research/tree/main/wp01-opening-gap-breakouts
- The attached backtest below uses the code in qc/nq_orb_2015_2026 of the repository.
Two questions
Has anyone seen the opening-bar volume change in other data sources? And for those who trade opening range rules live: how do you handle the shortened sessions, when the market closes before the exit time?
This is research, not investment advice. All numbers are backtests after costs.


Ludwig J Marx
The material on this website is provided for informational purposes only and does not constitute an offer to sell, a solicitation to buy, or a recommendation or endorsement for any security or strategy, nor does it constitute an offer to provide investment advisory services by QuantConnect. In addition, the material offers no opinion with respect to the suitability of any security or specific investment. QuantConnect makes no guarantees as to the accuracy or completeness of the views expressed in the website. The views are subject to change, and may have become unreliable for various reasons, including changes in market conditions or economic circumstances. All investments involve risk, including loss of principal. You should consult with an investment professional before making any investment decisions.
This discussion is closed