


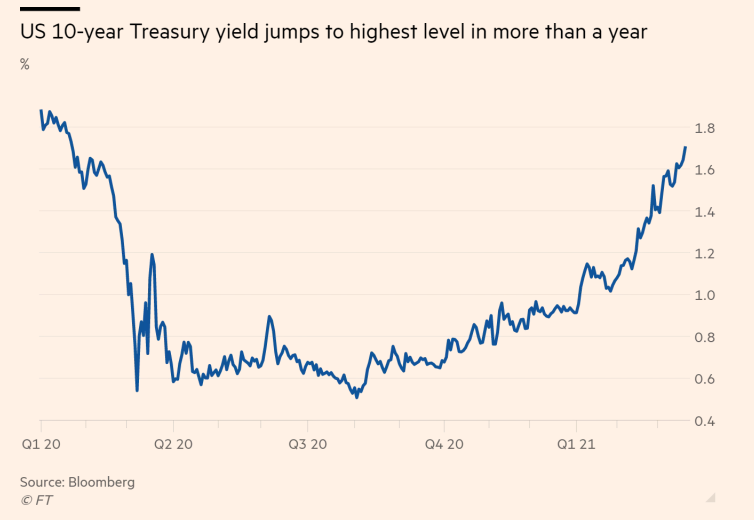
On March 18, 2021, the Financial Times reported that the yield on 10-year Treasury notes reached a 14-month high of 1.75%. The article suggested that the rise in bond yields is what led to “volatile moves in high-growth stocks as investors reprice the value of their shares based on changes in interest rate expectations”. Here’s a plot of the rising bond yields:
We were intrigued by the relationship between rising bond yields and the market shocks that follow. So in Idea Streams episode #12, we investigate whether we can capitalize on the relationship.
Our Process
The data we have included on the QuantConnect platform for the SPY ETF that tracks the S&P 500 index only goes back as far as 1998. But we wanted to test our strategy over a longer period of time, so we imported a custom data set that includes data for the index since 1970. This allowed us to set the start of our backtest to January 1, 1970.
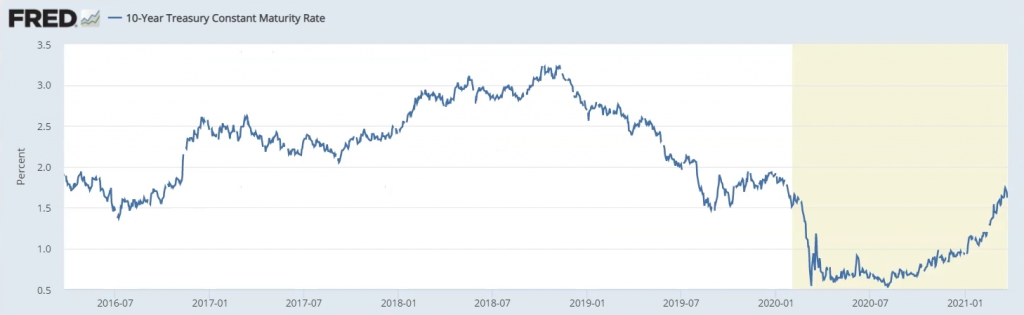
We gathered the bond yield data set from the Federal Reserve Economic Data website. To get the bond yield data into our trading algorithm, we created another custom data importer. The data set we used was the 10-Year Treasury Constant Maturity Rate. Here’s what the data looked like:
With all of our data collected, we created our strategy logic. The idea is that we want to stay invested in S&P 500 at all times but exit when there has been a large increase in bond yields. This way, we avoid any potential downturn caused by the shock in bond yields and re-enter after the downturn has passed. To quantify our approach, we defined a “large increase in bond yields” to be when bond yields have risen by more than 2.5 standard deviations above the 90-day average.
if yield_value > yield_avg + 2.5*yield_std:
    self.liquidate()
elif not self.portfolio.invested:
    self.set_holdings(self.spx, 1)
There were two reasons we decided to monitor the standard deviation of the yield relative to its mean instead of using a proportional increase in the yield. First, by using standard deviation, we avoid using an arbitrary number like a 20% increase in yield over the past 90 days. Second, the yield figure has fallen over the last 50 years, so a rise in the yield from 1% to 2% is a much larger proportional increase (100% increase) than a rise in the yield from 10% to 11% (10% increase).
Results
To judge the results of our strategy, we ran two backtests. The first backtest just bought the S&P 500 index and held until the current day. The second backtest was our strategy outlined above. Here are the results we noticed:
| Buy and Hold | Strategy | |
|---|---|---|
| Sharpe Ratio | 0.536 | 0.604 |
| CAGR | 7.593% | 8.558% |
| Trades | 1 | 229 |
In conclusion, the strategy outperformed the benchmark, achieving a higher Sharpe ratio and CAGR. Additionally, the strategy logic led to the portfolio liquidating the holdings on March 1, 2021, so if we had been trading it in real-time, we would have been out of the market when the Financial Times article was released discussing how growth stocks have been crashing. To view the source code of this project, clone the backtest below.


Ollie Hooper
The material on this website is provided for informational purposes only and does not constitute an offer to sell, a solicitation to buy, or a recommendation or endorsement for any security or strategy, nor does it constitute an offer to provide investment advisory services by QuantConnect. In addition, the material offers no opinion with respect to the suitability of any security or specific investment. QuantConnect makes no guarantees as to the accuracy or completeness of the views expressed in the website. The views are subject to change, and may have become unreliable for various reasons, including changes in market conditions or economic circumstances. All investments involve risk, including loss of principal. You should consult with an investment professional before making any investment decisions.
To unlock posting to the community forums please complete at least 30% of Boot Camp.
You can continue your Boot Camp training progress from the terminal. We hope to see you in the community soon!