


During the 2020 presidential race, the policies proposed by each candidate were expected to greatly impact the stock market. In particular, an article released by the Financial Times in July featured estimates from Goldman Sachs that if Biden reversed the corporate tax cuts that Trump introduced, it “would take about 12% off the total 2021 earnings-per-share of the constituents of the S&P 500“. The article continued by highlighting Biden’s plans to expand Medicare and renegotiate the price the government pays pharmaceutical groups for drugs. The first statement suggests that if Biden wins, companies with high EPS may decrease in price because people will move their money into shares with more growth potential. The second statement suggests that if Biden wins, healthcare stocks could be a good investment for the future because the government will be increasing its spending on healthcare.
As the election progressed over time, the public’s support for each candidate naturally fluctuated. Several gambling websites even allowed speculators to place bets on who they thought would win the presidency. To gain wisdom from the crowd, RealClearPolitics consolidated betting data from 8 gambling websites and produced a plot that shows the likelihood of each candidate winning based on betting averages.
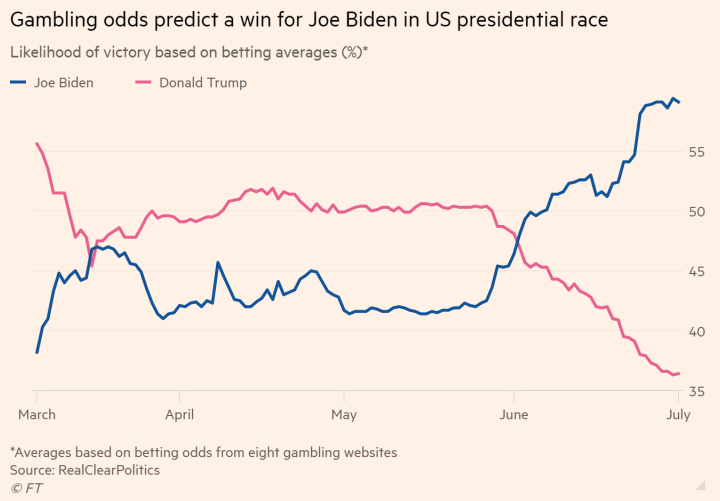
Fortunately, the consolidated data from RealClearPolitics is freely available to download. So in this episode of Idea Streams, we test the hypothesis that an increase in the likelihood of Biden winning the presidency leads to an increase in price for healthcare stocks and a decrease in price for stocks with high EPS.
Our Process
To get the consolidated betting data from RealClearPolitics into our trading algorithm, we downloaded a JSON file from their servers at the beginning of our backtest. Once downloaded, we manipulated the data so that instead of streaming in the likelihood of each candidate winning, the stream represents how many percentage points Biden is ahead of Trump. The earliest data point in the file is March 13, 2020, so we specified our backtest to start on that date. To ensure we always have betting data available, we set the backtest to end when the last data point in the file is reached. We created this algorithm in July 2020, so the last data point in the file at the time was July 17, 2020.
self.download('https://www.realclearpolitics.com/json/odds/event_1_final.json?1595265370902')When selecting the securities to include in our universe each day, we select the top 100 most liquid stocks that are above $5 per share.
selected = [c for c in coarse if c.price > 5 and c.has_fundamental_data]
sorted_stocks = sorted(selected, key=lambda c: c.volume, reverse=True)
return [stock.symbol for stock in sorted_stocks][:100]
Of the 100 securities, we first select all of the companies that are classified by MorningStar as being in the healthcare sector and include them in our universe. Of the remaining securities, we select the ones with the highest EPS so that half the universe is healthcare stocks and half is high EPS stocks.
As betting data is streamed into the algorithm each day, we compute the percentage change of the data over the last 5 days. If the change is greater than our threshold of 10%, we instruct the portfolio construction model to long the healthcare stocks and short the high EPS stocks for the next 5 days. Conversely, if the change is less than -10%, we instruct the portfolio construction model to short the healthcare stocks and long the high EPS stocks.
if abs(pct_change) > self.thresh:
    healthcare_direction = InsightDirection.UP if pct_change > 0 else InsightDirection.DOWN
    high_eps_direction = InsightDirection.DOWN if pct_change > 0 else InsightDirection.UP
We monitored the percentage change instead of what the current betting odds are currently at because if Biden has a 75% likelihood of winning, these odds will be priced into the healthcare and high EPS stocks after a while. With this algorithm, we want to monitor when the likelihood changes, so we can capture the movement of when the stocks get priced to a different level.
Results
After running the backtest, the strategy produced a 3.4 Sharpe ratio and a 76.8% PSR. Over the three months period, the algorithm made 1827 trades. With a starting cash balance of $100K, the trading volume amounted to $10M and we had $4K in fees. To reduce the fees incurred with running this strategy, we recommend introducing a turnover constraint or rebalancing the portfolio less frequently.
Since our backtest ended in July 2020, we also recommend testing the performance of this strategy from July until election day in November. The betting odds have been more volatile during that time, so it’s possible that the healthcare stocks and high EPS stocks could have seen big movements as investors prepared for the election outcome. To get a copy of the strategy code, clone the backtest below.


Ollie Hooper
The material on this website is provided for informational purposes only and does not constitute an offer to sell, a solicitation to buy, or a recommendation or endorsement for any security or strategy, nor does it constitute an offer to provide investment advisory services by QuantConnect. In addition, the material offers no opinion with respect to the suitability of any security or specific investment. QuantConnect makes no guarantees as to the accuracy or completeness of the views expressed in the website. The views are subject to change, and may have become unreliable for various reasons, including changes in market conditions or economic circumstances. All investments involve risk, including loss of principal. You should consult with an investment professional before making any investment decisions.
To unlock posting to the community forums please complete at least 30% of Boot Camp.
You can continue your Boot Camp training progress from the terminal. We hope to see you in the community soon!