


qb = QuantBook()
eurusd = qb.AddForex("EURUSD")
startTime = datetime(2020,2,5,17,40)
history = qb.History(eurusd.Symbol,
startTime - timedelta(minutes = 120),
startTime + timedelta(minutes = 20),
Resolution.Minute)
history.set_index(np.array([i for i in range (-120, 20)]), inplace = True)
print(history.shape[0])
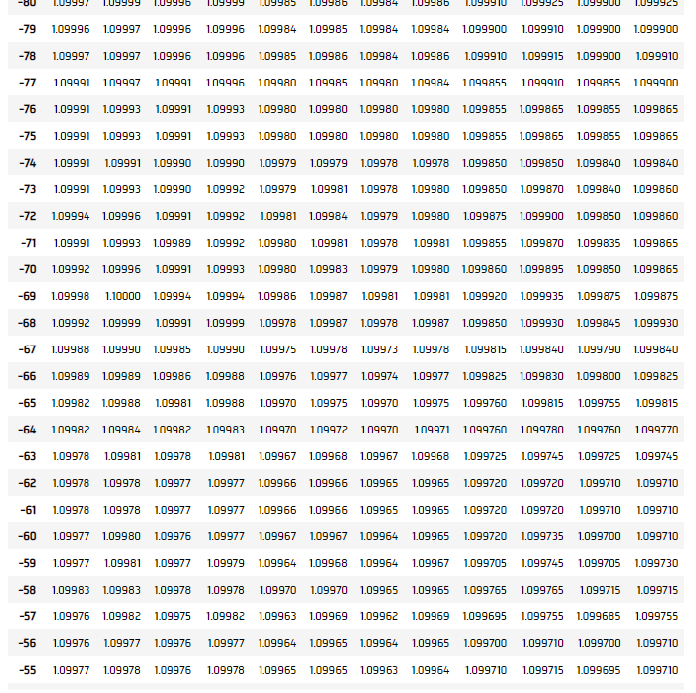
historyoutput: a normal dataframe from -120 to 19 with size 140 with no strange values
Hello,
I have troubles regarding the indicators in research notebooks.
I am researching on EUR/USD data by generating random timepoints and looking at data 120mn before that timepoint (known data to use for prediction) and 20mn after that timepoint (data to predict).
However, I sometime run across trouble where I have good quality historical data for a timeframe (AKA no NaN, no missing values and so on). The example above illustrate this.
But when I fetch the sma indicator, and try to apply it to the 20mn after my timepoint (to evaluate the future trend), there are discrepencies in my row number output. I have to start initiating the indicator before my start point so it can warm up, however sometimes it results in this:
for i in range (20):

    smaDf = qb.Indicator(SimpleMovingAverage(5),
                                eurusd.Symbol,
                                startTime - timedelta(minutes = i),
                                startTime + timedelta(minutes = 20),
                                Resolution.Minute)

    print(str(i) + "\t" + str(smaDf.shape[0]))
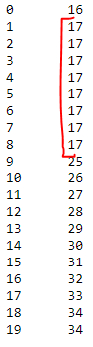
output: the dataframe size does not increment for a while, then catch up
If someone has any advices or explainations, I'd be glad to read them.
Note that the startpoint I used was randomly found in my work, but it happens in all years, months and daytimes whith consistent historical data.


Louis Szeto
Hi Loup
Thank you for spotting this. One of our data providers FXCM has missing data during 2020-02-05 5:32pm - 5:34pm (2 minutes), so a total of 7 data points (5+2 minutes) of the SMA(5) indicator is affected. Please subscribe to this data issue for follow-up. Meanwhile, you can use Oanda's data by
Please note that QuantConnect is no longer supporting FXCM for live trading.
Best
Louis
Loup Petit
Hi Louis,
Thank you for providing the explaination to this cryptic issue !
Best
Loup Petit
The material on this website is provided for informational purposes only and does not constitute an offer to sell, a solicitation to buy, or a recommendation or endorsement for any security or strategy, nor does it constitute an offer to provide investment advisory services by QuantConnect. In addition, the material offers no opinion with respect to the suitability of any security or specific investment. QuantConnect makes no guarantees as to the accuracy or completeness of the views expressed in the website. The views are subject to change, and may have become unreliable for various reasons, including changes in market conditions or economic circumstances. All investments involve risk, including loss of principal. You should consult with an investment professional before making any investment decisions.
To unlock posting to the community forums please complete at least 30% of Boot Camp.
You can continue your Boot Camp training progress from the terminal. We hope to see you in the community soon!