


Hi everyone!
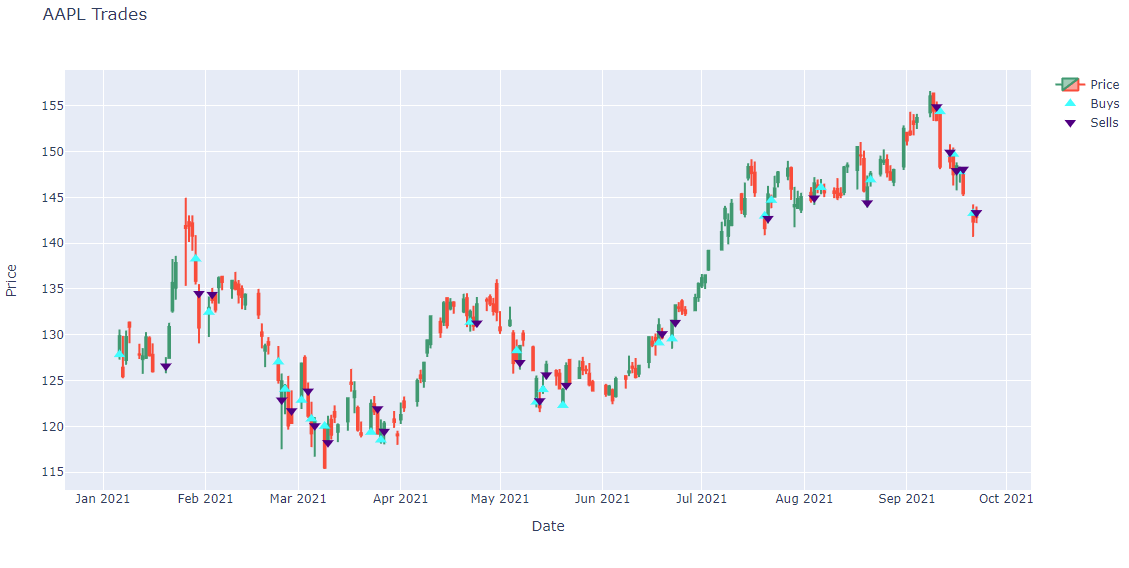
We added a new tutorial to the documentation that demonstrates how to use the API to get your backtest orders into the Research Environment and then plot the fill prices on interactive Plotly charts. The script creates a plot for each asset you trade in your backtest so you can visually investigate your algorithm's trading behavior.
To view the full tutorial, see Reading Orders.
Best,
Derek Melchin


Yuri Lopukhov
Note: The preceding plots only show the last fill of each trade. If your trade has partial fills, the plots only display the last fill.
hmm, can backtest contain partial fills?
Also, it would be nice to be able to plot live trades as well…
p.s. I can see quotation formatted in the post editor, but after publishing the formatting is gone…
Derek Melchin
Hi Yuri,
It's possible to get partial fills in a backtest with a custom fill model.
Best,
Derek Melchin
The material on this website is provided for informational purposes only and does not constitute an offer to sell, a solicitation to buy, or a recommendation or endorsement for any security or strategy, nor does it constitute an offer to provide investment advisory services by QuantConnect. In addition, the material offers no opinion with respect to the suitability of any security or specific investment. QuantConnect makes no guarantees as to the accuracy or completeness of the views expressed in the website. The views are subject to change, and may have become unreliable for various reasons, including changes in market conditions or economic circumstances. All investments involve risk, including loss of principal. You should consult with an investment professional before making any investment decisions.
To unlock posting to the community forums please complete at least 30% of Boot Camp.
You can continue your Boot Camp training progress from the terminal. We hope to see you in the community soon!