


Abstract
This post will summarize the research and cross-checking process we used to build our open-source implementations of Implied Volatility and Greek indicators for LEAN. After validating our implementations with two external sources, we can be confident our implementations are accurate for a wide range of strikes, expiries, and asset volatilities. Notably, we discovered potential issues with another popular open-source implementation and reverse-engineered the implementations of our third-party cross-check vendors.
Project Goals
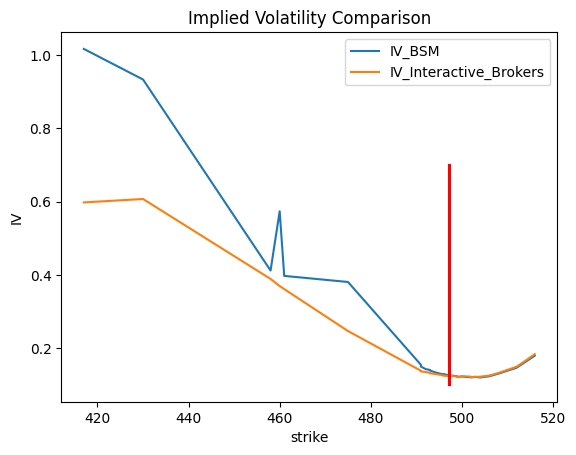
To date, we have used the vanilla Black-Scholes-Merton (BSM) model to calculate Implied Volatility (IV) using the QuantLib library. We also observed that BSM's IVs differ from popular Option data vendors, like Interactive Brokers (IB), so we aim to improve our IV modeling.
We started by re-implementing multiple option pricing models in pure C# code, with QuantConnect indicators, to precisely match the QuantLib package. We expect a smooth volatility smile -- a symmetric U-shape parabola of IV against log-moneyness (due to the conditional expectation of log-normal price distribution assumption). To achieve the smooth smile that match third-party sources better, we overlay smoothing functions.
Unlike QuantConnect, third-party sources do not open-source how they calculate IV and Greeks, so we must experiment to get close approximations. Cross-validation is difficult as all the third-party sources we checked have different values.
We aim to produce realistic, accurate IV values, giving you an edge in obtaining the correct hedging size and capitalizing on arbitration opportunities when mispricing happens.
Our Process
Indicator Implementation
Over three months of research, we implemented flexible IV and Greek indicators from scratch. It provides flexibility in calibrating IV with custom objective functions and smoothing functions, which can incorporate the price of the call-put counterpart of the Option contract with the same strike and expiry in calculating a fair IV. This allows various IV smoothing techniques, such as call-put parity under the Law of One Price (BlackScholes.pdf (columbia.edu)), to fit our expectations of a smooth and symmetric IV smile.
def initialize(self):
    strike, expiry = 505, datetime(2014, 6, 27)
    option = Symbol.create_option("AAPL", Market.USA, OptionStyle.AMERICAN, OptionRight.PUT, strike, expiry)
    self.add_option_contract(option)

    mirror_option = Symbol.create_option("AAPL", Market.USA, OptionStyle.AMERICAN, OptionRight.CALL, strike, expiry)
    self.add_option_contract(mirror_option)

    # A call-put counterpart is required for smoothing the IV
We did this without relying on QuantLib for the modeling. This was done to have more control over community-reported bugs in the QuantLib package. Going forward, we will use Lean's new in-built Option indicators to produce IV values.
The ImpliedVolatility indicator constructor takes the following arguments:
We can customize the smoothing function with the set_smoothing_function method. It takes a callable function that takes in 2 arguments of the modeled IVs using vanilla backpropagation from the selected Option pricing model for both the Option contract and its call-put counterpart and returns a numerical value of the smoothened IV.
# For example, we take the average
self._iv.set_smoothing_function(lambda iv, mirror_iv: (iv + mirror_iv) / 2)
Please refer to the docs here for technical details of the QC Option indicators. [Option Indicators - QuantConnect.com]
Cross Validation Summary
We tested our ImpliedVolatility indicator against three different third-party sources. In each case, we obtained thousands of data points with different Option rights, Option styles, strike prices, Option market prices, underlying prices, and time until expiration.
We experimented with initializing our ImpliedVolatility indicator with various Option models and smoothing functions to find the best match (by lowest mean-squared error, MSE) to the reference vendor data source. The table below has summarized the final results:
We calculated the error at every strike to understand the accuracy of our new indicators compared to third-party sources. We formed a distribution of the errors grouped into 1%, 5%, and 10% buckets. If a sample point had a 4% error, it was included in the "Within 5%" and “Within 10%" buckets but not the "Within 1%" one.
Cross-validation with QuantLib
With our bespoke implementation, we could perfectly replicate the IV values from QuantLib. It applied a plain BSM model for calculating IV and was easily reproduced. Although this did not help our project goals, it provided a benchmark for our indicator's reliability and accuracy. The image below plots the IV of QuantConnect and QuantLib on the SPY Option (Exp: 9 Feb 2024) from 7 Feb 2024.
# Parameters to match QuantLib IV Curve.
iv = self.iv(contract_symbol, risk_free_rate=None, dividend_yield=None, option_model=OptionPricingModelType.BLACK_SCHOLES)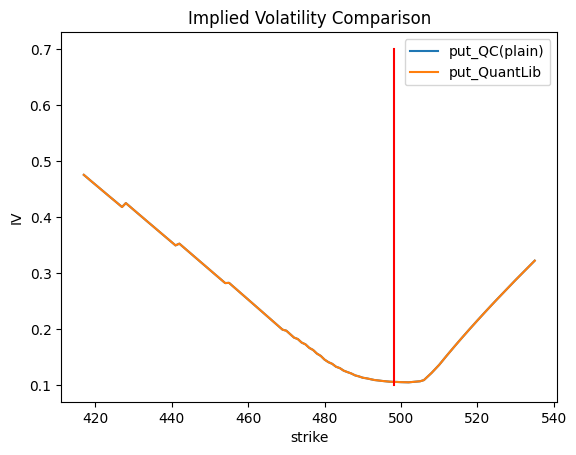
Cross-validation with Interactive Brokers
As a popular broker, IB is also a popular source of Option IV and Greek data. We obtained IB's IVs by caching real-time IV and Greek quotes during trading hours and tried to reproduce IB's figures by reverse-engineering. We observed the following points:
- Contracts with the same strike price, expiry, and underlying asset had the same IVs for call-and-put contracts.
- When plotting the IB IV they had a smooth and symmetric IV smile.
The Interactive Brokers IV values seemed to be a good goal given the textbook-like smoothness of their curve. We reached out to IB to ask for more information on their model, but they only provided a broad explanation resembling their website without too many details:
- The BSM model for European Options, and a 100-step Binomial model for American Options.
- The Eurodollar contract's spot rate to calculate the interest rate.
- A 1-year lookback of dividend payments to calculate the dividend yield.
Although the exact methodology remains proprietary, we can narrow down the parameters they were using and approximate them through trial and error (with MSE as the criterion). We tried all combinations with the below choices on different parameters, and obtained the best-fitted combination in bold:
After updating the IV indicator with the preceding parameters, the errors lie mostly about 4-6%. This result holds for any contract, strike range, and expiries. Thus, it is reasonable to think that the Option pricing model and IV smoothing function are very close to what IB adapted while suspecting an unmatched hyperparameter or a missing term on the pricing model.
The below image shows an example of IV cross-matching of our indicator values versus IB's values, on the SPY Option (expiring on 9 Feb 2024) data from 7 Feb 2024.
# Parameters to match Interactive Brokers IV curve.
iv = self.iv(call_contract_symbol, mirror_option=put_contract_symbol, risk_free_rate=None, dividend_yield=None, option_model=OptionPricingModelType.FORWARD_TREE)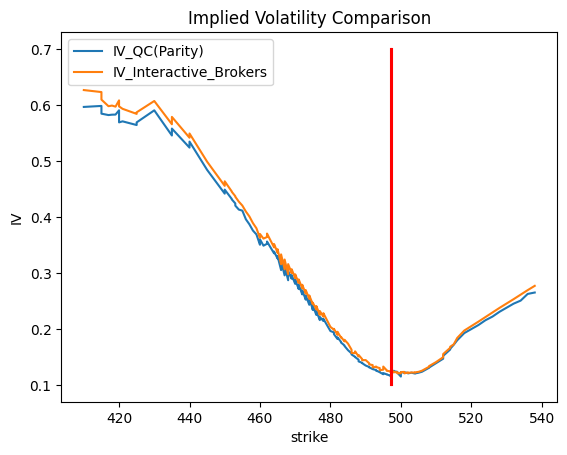
Cross-validation with Third Party
We chose another popular third-party source for comparison. We do not know much about the third source's methodology but only know that they use a modified binomial model, and a custom dividend yield model involving put-call parity. We tried a similar approach of trial and error to determine the best parameters. We were able to obtain a close match on ATM and ITM contracts, but not the OTM ones. Let's explain with an example of the same case.
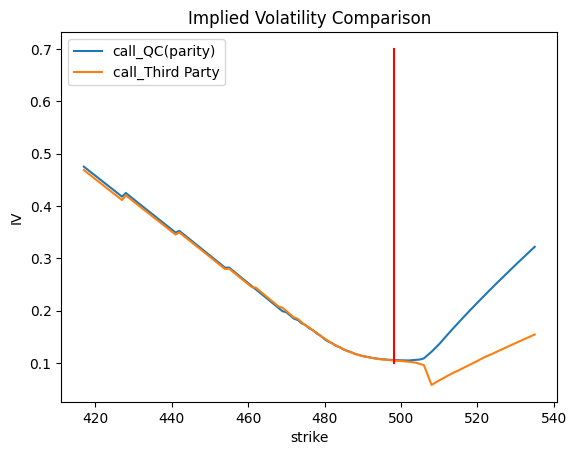
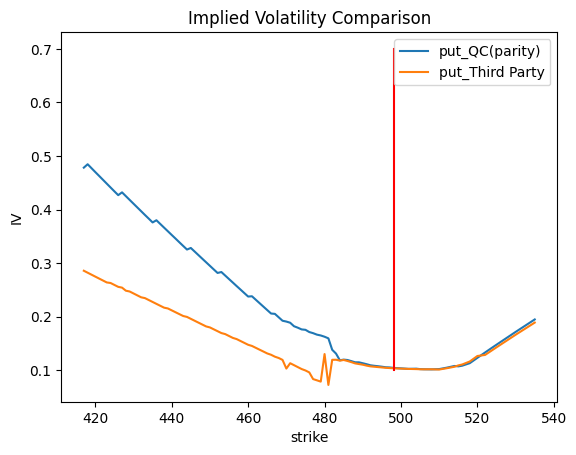
The images show a near-perfect match for ATM/ITM calls and ATM/ITM puts, so we are confident that IVs of ATM and ITM Options are calculated this way, but not OTM Options. From the curves, we can observe a sudden jump (at around $ 507 strike calls and $ 480 strike puts) in the curve. Since the jump happened only 1-2 times, and affected the subsequent strikes, this suggests the vendor might fit the whole IV surface at once, with an underlying process involving a stochastic Levy jump process, or mixture distribution of the underlying price series, so that the probability expectation of the future price is discontinuous at some price levels. This violates our goal of a smooth IV smile. Generally, we seek a smooth curve to reduce arbitrage opportunities which can be exploited with jumps. The Heston stochastic pricing model is typically the gold standard and results in smooth IV curves.
Results
The table below summarizes the results of matching third-party source IVs with Lean's ImpliedVolatility indicator, from the discussions in previous sections.
For example, an accuracy of 75% under the column 5% means 3 out of 4 IV values would be within 5% error (i.e. IV of 1.0 recorded from reference, and 0.95-1.05 calculated by our indicator).
Conclusion
Option pricing is both science and art. It is crucial to understand how an Option is priced and the rationale behind IV, from risk management through hedging to speculation or arbitration traders.
One advantage of mirror Option implied volatility smoothing is its ability to reduce noise and fluctuations in volatility estimates. By applying mathematical algorithms or statistical methods, mirror Option implied volatility smoothing can provide a more stable and reliable estimate of implied volatility. This can be particularly useful when the underlying asset exhibits high volatility or when limited data points are available. However, it could be computationally intensive without analytical or numerical solutions to directly deduce the IV. It is also subjective and sensitive to the pricing model choice and smoothing function.
Lean’s new ImpliedVolatility indicator allows high flexibility on the choice of Option pricing model and the smoothing process for calculating IV, providing a sharp tool for conquering the quest for a true, fair Option price.


Alexandre Catarino
The current implementation doesn't account for dividend yield for Index Options. To improve this aspect, we have created a GitHub issue.
The option indicators accept a fixed dividend yield value. The mean dividend yield for SPY (proxy to SPX) was 0.1 in the last five years.
Roni Winik
This is amazing! thanks for posting it. That's a great starting point for option trading.
Tyson
I modified the algorithm above and added it to a backtest that I'm working on. The backtest sells an ATM Call and an ATM put and passes the symbol of one of the options to the getGreeks function. The delta for the ATM contract should be close to 0.5, but option.d.current.value is saying that the delta is 0.28.
I'm new to quantconnect and I'm sure I'm doing something wrong just not sure what it is.
Leo Kamgar
There is an issue with these indicators on 0dte options. For example, using the Implied Volatility indicator on 0dte options in the research environment yields IV values of 0
Farshad Fahimi
Change this line: right = OptionRight.CALL if symbol.id.option_right == OptionRight.Call else OptionRight.Put
Vasily Aristarkhov
I see the big difference in IV for ultra-short options (ODTE) SPX with IB or Charles Schwab, the difference is almost two times. Seems, there is additional implied volatility decay closing the expiration? Can somebody help to explain?
QuantConnect Team
The material on this website is provided for informational purposes only and does not constitute an offer to sell, a solicitation to buy, or a recommendation or endorsement for any security or strategy, nor does it constitute an offer to provide investment advisory services by QuantConnect. In addition, the material offers no opinion with respect to the suitability of any security or specific investment. QuantConnect makes no guarantees as to the accuracy or completeness of the views expressed in the website. The views are subject to change, and may have become unreliable for various reasons, including changes in market conditions or economic circumstances. All investments involve risk, including loss of principal. You should consult with an investment professional before making any investment decisions.
To unlock posting to the community forums please complete at least 30% of Boot Camp.
You can continue your Boot Camp training progress from the terminal. We hope to see you in the community soon!