


Hello,
I’m experiencing some issues with chart display in my algorithm.
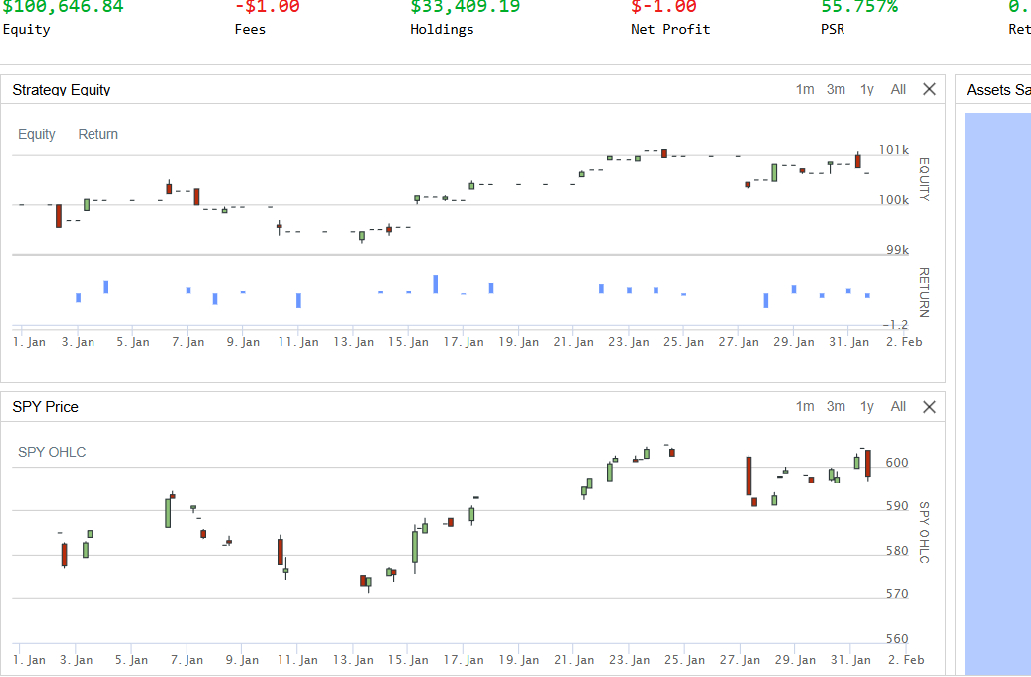
The equity chart sometimes shows candles that appear compressed or incorrect.
And my “SPY Price” chart does not reflect the correct timeframe. I would like to force a specific timeframe, for example Minute, even if the symbol is added with an Hour resolution.
Additionally, there are gaps in the quotes/data.
Could this be due to an error in my code or configuration? Any guidance on how to properly enforce the desired timeframe and fix the chart display would be greatly appreciated.
Thank you!
from AlgorithmImports import *

class DeterminedSkyBlueJaguar(QCAlgorithm):

    def initialize(self):
        self.set_start_date(2025, 1, 1)
        self.set_end_date(2025, 2, 1)
        self.set_cash(100000)

        self.SPY = self.add_equity("SPY", Resolution.HOUR).symbol

        chart = Chart("SPY Price")
        chart.add_series(Series("SPY OHLC", SeriesType.CANDLE, 0))
        self.add_chart(chart)

    def on_data(self, data: Slice):
        if not self.portfolio.invested:
            self.set_holdings(self.SPY, 0.33)

        if data.contains_key(self.SPY):
            bar = data[self.SPY]
            self.plot("SPY Price", "SPY OHLC", bar.close)


Audric
The material on this website is provided for informational purposes only and does not constitute an offer to sell, a solicitation to buy, or a recommendation or endorsement for any security or strategy, nor does it constitute an offer to provide investment advisory services by QuantConnect. In addition, the material offers no opinion with respect to the suitability of any security or specific investment. QuantConnect makes no guarantees as to the accuracy or completeness of the views expressed in the website. The views are subject to change, and may have become unreliable for various reasons, including changes in market conditions or economic circumstances. All investments involve risk, including loss of principal. You should consult with an investment professional before making any investment decisions.
To unlock posting to the community forums please complete at least 30% of Boot Camp.
You can continue your Boot Camp training progress from the terminal. We hope to see you in the community soon!