


The CSI 300 is a capitalization-weighted stock market index that tracks the top 300 stocks listed on the two main stock exchanges in mainland China. In April 2020, South China Morning Post reported that “the 120-day correlation between the CSI 300 Index and the S&P 500 index recently rose to its highest level since Bloomberg began compiling the data in 2002.” The rise in correlation can be seen from the plot below.
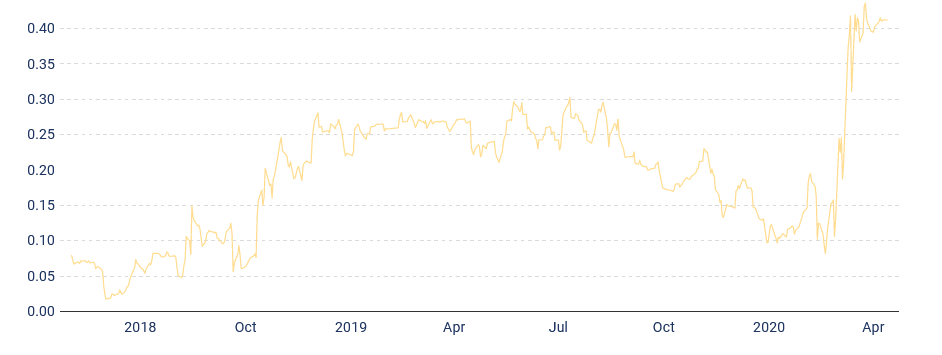
We attribute the increase in correlation to be a result of the coronavirus disrupting global supply chains. With such a significant spike in correlation, the benefits of diversification diminish as securities move closer in tandem with each other. To remain diversified amidst global market correlations, this episode of Idea Streams is focused on composing a portfolio of uncorrelated assets.
The Process
We start by attempting to reproduce the correlation plot above. We include SPY as the ETF to track the S&P 500 index. Since there is no CSI 300 ETF listed in the US, we select the next best option available to us to track China’s large-cap market, which is FXI. To extend our study to include other countries that were greatly affected by the coronavirus, we include an ETF that tracks the Italian market (EWI) and European market (VGK). Lastly, we also include GLD and SHY to track the correlation of SPY with gold and US bonds, respectively.
With all of our securities selected, we compute a rolling 120-day correlation between SPY and the other securities. From the plot that’s produced, we can see the characteristic spike in the correlation between FXI and SPY during March 2020.
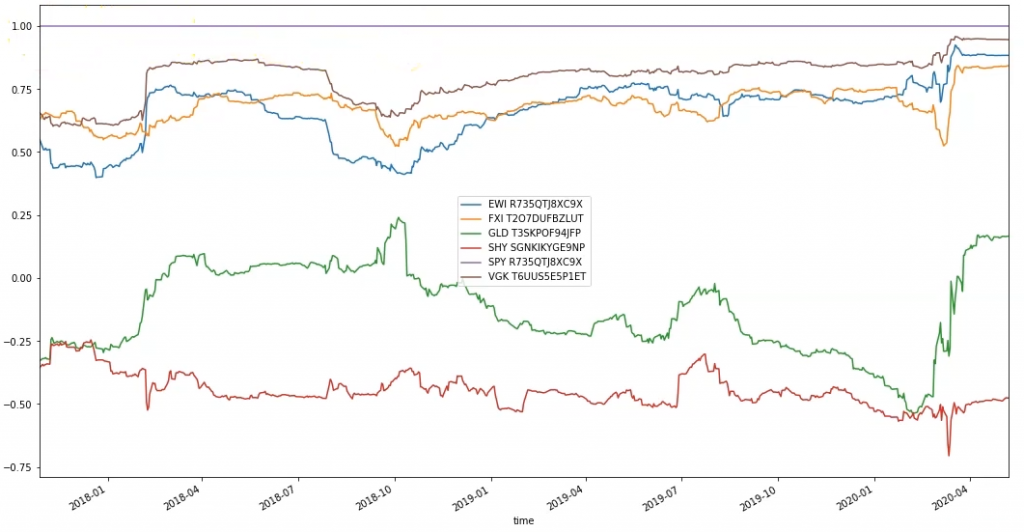
To maintain a portfolio of uncorrelated assets, we define our trading algorithm to rebalance the portfolio every trading day 5 minutes after the open. During each rebalance, we instruct the portfolio construction model to allocate half of the portfolio to SPY and half to the asset that has the lowest correlation with SPY over the last 120 days.
Results
Backtesting the strategy from January 1, 2019 resulted in a 0.813 Sharpe ratio and a 17.9% drawdown. In addition to these metrics, the strategy was also able to momentarily generate about a 98% Probabilistic Sharpe Ratio up until the 2020 crash. Since the SPY benchmark experienced a 35% drawdown during the same time period as our backtest, we conclude that our strategy outperformed the overall market benchmark.
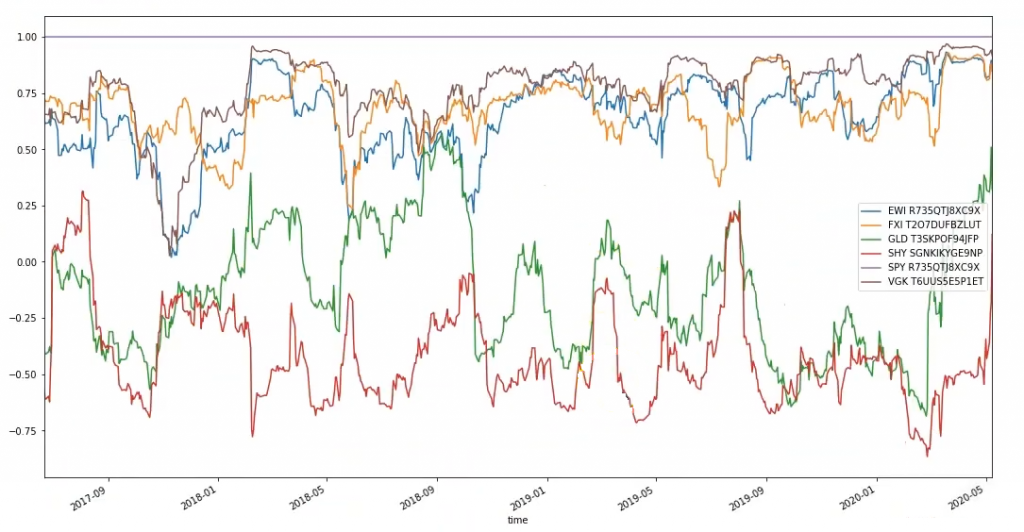
For those interested in continuing the development of this strategy, we recommend searching for ways to dynamically adjust the length of the lookback window used to compute the correlations. Instead of using a fixed 120-day window, defining a formula for the parameter value will allow the parameter to adapt as the market environment changes. One way to do this would be to look at the volatility of the market and use that to shorten the correlation period so that we are selecting assets that are uncorrelated over a shorter period of time. For instance, with a 30-day window, we can see the correlation signals contain much more noise, so the algorithm would change positions more frequently.
To get a copy of the strategy code, clone the backtest below.


Douglas Goullet
thanks for sharing. Isn´t 0.08% of average win to small of a profit after slippage and commission? thanks
Jared Broad
The material on this website is provided for informational purposes only and does not constitute an offer to sell, a solicitation to buy, or a recommendation or endorsement for any security or strategy, nor does it constitute an offer to provide investment advisory services by QuantConnect. In addition, the material offers no opinion with respect to the suitability of any security or specific investment. QuantConnect makes no guarantees as to the accuracy or completeness of the views expressed in the website. The views are subject to change, and may have become unreliable for various reasons, including changes in market conditions or economic circumstances. All investments involve risk, including loss of principal. You should consult with an investment professional before making any investment decisions.
To unlock posting to the community forums please complete at least 30% of Boot Camp.
You can continue your Boot Camp training progress from the terminal. We hope to see you in the community soon!