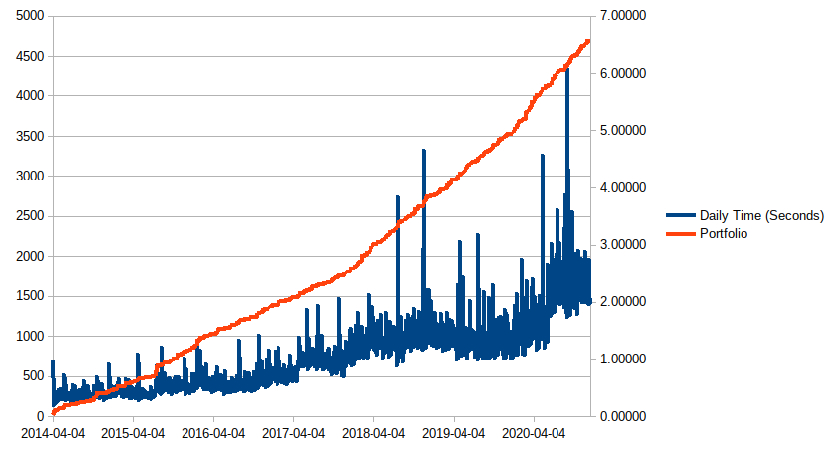
I have been running an option only strategy and have noticed for some time that trades from late 2010 to now. The strategy has good performance the first couple years and then gets increasing slower till the last couple years taking quite sometime (1-2 hours per year where first few years take 5-10 mintues).
The strategy does not do anything different over time and based on some debug output, keeps a narrow range of invested option securties through time as you can see below (yellow line / right axis). What I did notice however is that the total number of securities in the Portfolio (SecurityPortfolioManager) corelated really well with the slowness increase (blue line / left-axis) as the number increased (red line / right axis). The number of securities in the Portfolio is order of magnitudes larger than what it is invested in and what has been traded cumulatively in the past
I was fairly sure that there was noting in my strategy code that should be getting slower through time but harnessing it up in all the places to ensure that was a lot more work then just trying a very simple test strategy (attached). Basically all it does is try to trade a single contract everyday if it can, but once the holdings get above 15, it liquidates some to get back down to a max of 15. It also never trades the same contract again to ensure that it is infact increasing its current or closed position count. On 'OnEndOfDay(); call, I calculate the total seconds since that point the previous day and log it with a count of total portfolio symbols (Portfolio.Count()), how many are actually invested now (Portfolio.Count(kvp => kvp.Value.Invested), How many unique symbols the startegy has 'seen' i.e. grabbed from option chain and tried at least to trade it, how many unique symbols in total have been traded, and how many unique symbols in total have been in the option chain.
Here we see a similar correlation. Ideally, this startegy is so naive and simple, I would expect a minor (almost imperceivable) increase over time for overhead of maintaining past data, but it is growing 3-5x.
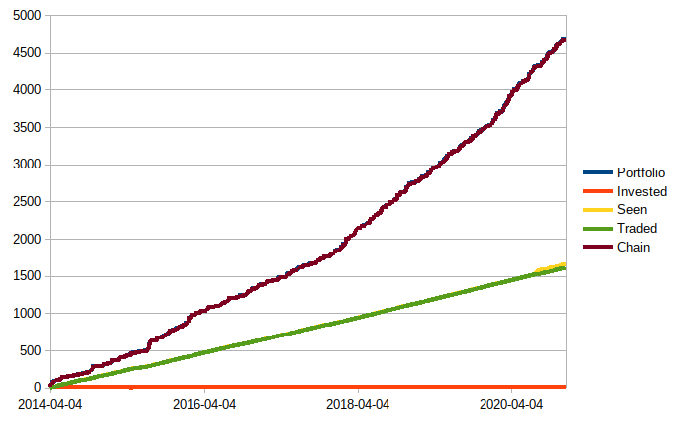
I don't know if this is related to the Portfolio and perhaps additive time each day with the growing number of securities it is tracking. However, most are not relevant to the strategy.... they were never traded, and on top of that, expired. Here are the counts to see better:
Portfolio count and Chain count are almost identical so they overlap and you can't see both. Chain count is always 2 less that total Portfolio count. I am assuming the chain securities are auto added to Portfolio regardless and the remaining two is the underlying mapped to two securities or symbols for pre/post split (or something related).
The 'Traded' & 'Seen' amounts track very closely as expected and should only differ when there is a problem trading an option at Market which happens rarely (I 'see/pull' a contract from the chain). This concept of tracking only the contracts actually pulled from the chain is just to identify how many were never used or traded.
Here though, and this is a lot more trading than in my strategy but with similar Chain/Portfolio counts (i.e. why my strategy performed relatively worse), that the number of securities traded is well well below the number the Portfolio is tracking.
Last, the number actually invested, and thus not static, is never above 15.
I do not know if it is directly the Portfolio or perhaps a process that utilizes its universe that is causing the increased slowness, but it seems plausible. Even if not, I would be interested to know if there is a reason for keeping track of those non-traded or evaluated securities.
Maybe others have seen this, but based on the performance characteristics, I have a feeling you would not see this unless you were trading options over a multi-year history (depending on size of filtered option chain, large chains would show earlier). Even an equity strategy trading 100's of stocks over multiple decades would not see a noticible increase as the Portfolio count would never grow by very much. Only perhaps on splits (not sure how Portfolio handles this, but for options I would guess it is a new security, maybe not equities) or stocks being removed and then added to the universe.


Ari Cooperman
Forgot to mention, in terms of the chain filtering, the test restricts to the 30 - 90 days to expiration and +/- 10 strikes around ATM
option.SetFilter(u =>
u.Expiration(30, 90)
.Strikes(10, 10)
);
Jared Broad
Thanks Ari :) Is this in the cloud platform or locally? Really cool charts thank you.
We know there's a memory leak that causes the system to slow down as it handles more and more in RAM. We're working to identify and fix this issue
The material on this website is provided for informational purposes only and does not constitute an offer to sell, a solicitation to buy, or a recommendation or endorsement for any security or strategy, nor does it constitute an offer to provide investment advisory services by QuantConnect. In addition, the material offers no opinion with respect to the suitability of any security or specific investment. QuantConnect makes no guarantees as to the accuracy or completeness of the views expressed in the website. The views are subject to change, and may have become unreliable for various reasons, including changes in market conditions or economic circumstances. All investments involve risk, including loss of principal. You should consult with an investment professional before making any investment decisions.
Ari Cooperman
This was cloud/QC. I don't have the option data locally.
Just to add to this, based on the node stats you see in the Algorithm Lab, the memory it is reporting versus max available never goes above ~10% of available every time I check. Granted I am not looking at it continually, but never have seen it where I thought it was a garbage collection issue.
Let me know if I can provide anymore info.
Riley K
For anyone wondering, this is still a problem in Oct 2023.
Jared Broad
Great post thank you Ari; I missed this one in 2020. We're working a lot on speed at the moment we'll see if we can address it in November.
We already made a 900% speed up in fundamental data that will be released next week.
The material on this website is provided for informational purposes only and does not constitute an offer to sell, a solicitation to buy, or a recommendation or endorsement for any security or strategy, nor does it constitute an offer to provide investment advisory services by QuantConnect. In addition, the material offers no opinion with respect to the suitability of any security or specific investment. QuantConnect makes no guarantees as to the accuracy or completeness of the views expressed in the website. The views are subject to change, and may have become unreliable for various reasons, including changes in market conditions or economic circumstances. All investments involve risk, including loss of principal. You should consult with an investment professional before making any investment decisions.
Ari Cooperman
The material on this website is provided for informational purposes only and does not constitute an offer to sell, a solicitation to buy, or a recommendation or endorsement for any security or strategy, nor does it constitute an offer to provide investment advisory services by QuantConnect. In addition, the material offers no opinion with respect to the suitability of any security or specific investment. QuantConnect makes no guarantees as to the accuracy or completeness of the views expressed in the website. The views are subject to change, and may have become unreliable for various reasons, including changes in market conditions or economic circumstances. All investments involve risk, including loss of principal. You should consult with an investment professional before making any investment decisions.
To unlock posting to the community forums please complete at least 30% of Boot Camp.
You can continue your Boot Camp training progress from the terminal. We hope to see you in the community soon!