


This thread is meant to continue the development of the In & Out strategy started on Quantopian. The first challenge for us will probalbly be to translate our ideas to QC code.
I'll start by attaching the version Bob Bob kindly translated on Vladimir's request.
Vladimir:
About your key error, did you also initialize UUP like this?
self.UUP = self.AddEquity('UUP', res).Symbol


Peter Guenther
A call for additional in & out-type algos
We have several in & out algos in this thread and beyond, in multiple variants. I am sure that there will be additional exciting stuff coming, including the use of futures and sensitivity testing via QC’s Cloud Parameter Optimization / Sensitivity Testing.
However, reading the rationales, discussions, etc. you might say “nah, I would have done this completely differently, like so ...” I recall people mentioning chart-analytical techniques like breakouts in certain markets and other interesting ideas. If you have something that you are happy to share with the community, probably the best way is via a new QC thread, but do leave a post in this thread as well, just so that everybody who is interested in these kinds of tactics (including myself) is aware. It would be really cool to see some (fundamentally) different approaches to tackle the in & out problem. Keep on coding!
Peter Guenther
New Chart: The Annual Saw Tooth Returns - In & Out versus Always In
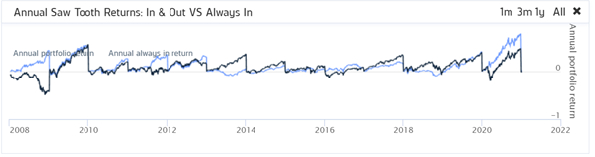
This time, no innovation on the algo itself but instead a new chart that might be useful. We have noted here and elsewhere that the In & Out is not directly meant to replace a stock selection strategy but can be an optional complement. In other words, the choice would be to run your stock selection strategy with an In & Out logic instead of running your stock selection strategy without this logic (= being always in). You would hope that the In & Out component acts like an insurance package against steep drawdowns in your strategy. However, we were wondering what the implicit costs of this insurance package are.
The chart takes an annual view on this question by comparing the returns of the In & Out execution of the stock selection strategy (light blue line) versus the always-in execution (black line) of the stock selection strategy (= QQQ in the attached algo). The returns are reset at the beginning of each year, hence the saw tooth pattern. The chart may be useful to understand the implicit costs of the In & Out in terms of underperformance during certain times. For instance, the below chart shows that the relative performance in 2013 is not great and there is a stretched out soft patch from 2017 to 2019.
PS: If someone knows an easier implementation to create the chart, I would be very interested. However, note that I have implemented the calculations for the chart so that the stock selection dictionary could consist of more than one stock (e.g. holding QQQ and SPY together) and then the chart should still be created correctly.
The attached algo also creates a chart to compare the three-month (60 days) returns of the In & Out versus always in.
The code for the calculations and charts are in lines 220-237. I initialize a few variables for the charts in lines 72-78.
Chak
Hey Peter,
You can consolidate the huge chunks of code if you incorporated a few if and elif statements. For example, X-month and Annual can fall under the same plot, if you're comfortable with clicking to highlight and unhighlight the additional labels. Alot of the code looks like copy paste. Try looking on stackoverflow for some hints.
Peter Guenther
Thanks, Chak, for your insights/guidance, much appreciated!
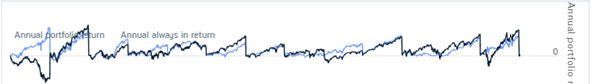
Saw Tooth Chart comparison: The Distilled Bear (top) and The In & Out (bottom)
Now that we have the Saw Tooth Chart, what we can do is to compare different in & outs regarding the distribution of their returns. Below is a pasted together view of the returns based on The Distilled Bear (top) and The In & Out (bottom) algos. The comparatively strong sections of The Distilled Bear seem to be in 2008, 2013 (substantial), 2016, and 2017. The In & Out performs comparatively better in 2011, 2012, and 2020 (substantial).
Implications
- can one in & out ‘learn’ from the other, resulting in a ‘super in & out’?
- should one mix the logics and simultaneously bet on both horses, e.g. 50-50?
- ...
Jack Pizza
Hey Peter Guenther how strong is the hypothesis with comparing industrials, gold, cash and their correlations? I'm sure a quick study can be done going back to almost 50-100 years on these broad markets?
My concern is if these correlations hold up or if they possibly break meaning the algo's in / out goes totally out the windows.
Also your thoughts on self stock selection vs ETF (stock selection chosen for you)
Peter Guenther
Elsid Aliaj, great questions! Regarding your first point, Menno did a test a while back, looking at a momentum strategy switching between equity, gold and bonds. The test was from 1875 to 2020 and the strategy seemed to generate systematic returns over this substantial time period. The strategy builds on a certain correlation between the involved assets. So we could argue that if the (negative) correlation was there the past 150 years, it is likely to be there in the future, although there might be phases when it's more muted versus stronger. For these situations where the correlation is muted, I definitely see the benefit of your earlier point that sometimes we might want to go into all cash.
Regarding the selection of individual stocks versus ETFs, ETFs can be efficient in terms of saving on commissions. So that is generally attractive. However, I reckon in the backtests we tend to select ETFs that we know had a good run in the past, creating a lookback bias. When we have a logic that systematically selects individual stocks from the universe of all stocks, e.g. based on fundamentals, the backtest results could be more valid. What are your thoughts?
Peter Guenther
Stream: Rich data modelists
Bringing it all together
As you know (see my earlier post), I was musing for some time now about whether it could be beneficial to combine the two in & out algos to create a ‘super’ in & out. The attached algo is a first attempt into this direction. There might be different ways how this could be done, e.g. see Derek Melchin’s suggestion to use correlations in the Amazing returns = superior stock selection strategy + superior in & out strategy thread.
The general idea of the attached implementation is that we track both algos and see how they are going return-wise and then increasingly switch to the overperforming one. A key variable is self.weight_inout_vs_dbear which is a number between 1 (fully on In & Out) and 0 (fully on Distilled Bear). It is determined (lines 263-272) via comparing the in & outs’ returns over a tight timeframe (10 days; see self.io_mom_lookback in line 112) so that we quickly capture comparative overperformance and switch.
The algo creates a plot for the weight towards the In & Out vs Distilled Bear (line 342) in the “In Out” chart.
The performances / total returns:
In & Out alone: 2,090%
Distilled Bear alone: 1,890%
New combo: 2,800%
The algo has a few features which are included because of other issues I want to explore but which have no relevance in the current setting, so feel free to ignore. For example, adding equities and alternative assets via ticker string (lines 45-59), including OnSecutiriesChanged (lines 149-164), and determining equities/alternative assets with the best momentum (lines 286-300). You also have a chart that tracks the cash level (line 331) and the Annual Saw Tooth chart (lines 334-337).
Jon Quant
I noticed that the recent algos now use "TIP" instead of "RINF" as a disambiguation signal. Is that better?
Liam Op
Hi Peter
Good job!
I just run a back-test for the same period
of v1.0 "Intersection of ROC comparison using the OUT_DAY approach" by Vladimir
It only has two variables, and more economical code (three times fewer lines), and it seem to get better results than yours.
What do you think?
Peter Guenther
Thanks for your post and positive note, Liam, appreciated!
Also thanks for sharing these results, I think that is fantastic.
With my ‘rich data modelist’ hat on (see the different camps/streams mentioned earlier), I would tend to think, let’s combine the three in & outs into one. It’s a fundamentally different mindset to the features you highlighted in your post (few parameters / lines of code) and that is OK. We can think about it this way: there is a continuum and you can allocate the following people on it in the following way:
[parameter minimalists] Menno <---- Vladimir ----> Peter [rich data modelists]
Now, just to clarify: the idea of combining the in & outs is not necessarily to boost performance, although this might happen in the process. It is rather about combining different logics, so that we do not have to pick one logic (‘a winner’) beforehand. Instead, we let the relative weights of the logics being determined empirically by the (future) data and how events unfold--this is the gist of what the post above tries to bring to the table. The weights are determined by the logics’ relative short-term performance. So, with this in mind, when we look at total return and number of parameters/lines of code of individual in & outs, I am not sure that we correctly capture what we might be able to develop here.
Vovik
Liam, Peter
I also see that v2.5 “Dual Momentum with Out Days” by Vladimir looks much better than InOut_DBear_v1.
Peter Guenther
Jon Quant, sorry almost missed your question there. Well spotted! It could be a bit better but I am not even sure. The rationale for replacing RINF is just that the ETF is only available from Jan 2012 onwards and I wanted to have something that I could build on from Jan 2008. So I am using the bonds - tip difference.
Peter Guenther
Vovik, we might be making a logical error with this comparison since the holdings are different (note FDN and TLH). It would be a bit like saying: "The Distilled Bear algo that Leandro posted here made 9,532%, so the "Distilled Bear" is better than the "Dual Momentum with Out Days" and the "In & Out".
In addition, I think that there could be value in moving beyond the comparison of individual in & outs and working on the question of whether it might be beneficial to combine them. Of course, be aware that this is 'rich data modelling' at its finest.
Liam Op
Peter,
Using definitions in your previous post:
> [parameter minimalists] Menno <---- Vladimir ----> Peter [rich data modelists]
I have the following questions/comments:
How did you determine that Menno belongs to "parameter minimalist" category?
Appreciate!
Peter Guenther
Liam Op, no worries. Check out page 2 of this thread, searching (Ctrl + F) for the term "Gedankenexperiment".
Vovik
Peter,
For comparison with Leandro Maia version Vladimir posted his v1.9
Peter Guenther
Interim stock taking
It’s been about half a year since the post below on Quantopian. Since then, much work has been done on multiple fronts. Merging this discussion into QuantConnect also has fired things up substantially.
This discussion has brought about multiple threads. An overview can be useful for people who want to explore all or some of the work that has been done. So here is a current list, approximately in chronological order:
- This thread. Focuses on developing in & out algos which then can be used to trade great stock selection strategies. It is an incubator for in & out-related ideas that are then further developed in dedicated threads.
- Amazing returns = superior stock selection strategy + superior in & out strategy (link). Focuses on combining in & outs with stock selection strategies, trying to find optimal combinations. Mostly uses the In & Out and Distilled Bear algos from this thread, combining it with leveraged ETFs (TQQQ and bonds), stock selections based on valuation (‘Valuation Rockets’), and stock selections based on quality fundamentals and momentum (‘Quality Companies in an Uptrend’).
- Dual Momentum with Out Days (link). Focuses on combining different in & outs (In & Out, Intersection of ROC comparison using Out_Day approach) with different equity ETFs (QQQ, FDN, IWF). Also, a focus on reducing the number of out signals (e.g. only using USD or Gold vs Silver and Utilities vs Industrials) as well as using leverage to boost returns.
- Intersection of ROC comparison using OUT_DAY approach (link). Focuses on combining the ‘Intersection of ROC comparison using OUT_DAY approach’ in & out algo with different equity holdings (e.g., combining QQQ, MSFT, and NFLX; FNGS; top 10 tech gainers). Also, discussion of sensitivity, leveraging, adding (trailing) stop losses, portfolio optimization, identifying 2x/3x bear and 2x/3x bull regimes.
- A very profitable version of IN and OUT, and why it is likely to fail in real life trading like its siblings (link). Argues that the in & out algos are overfitted and predicts that they will generate negative alpha in the future. Discusses strategies to test for overfitting and out-of-sampling testing. Also includes results from a parameter optimization run for the Dual Momentum In & Out.
- ROC comparison Utilities and Industrials (link). Focuses on minimizing the number of out signals to only one pair comparison (utilities vs industrials) and tests out-of-sample, compared to the other in & out backtests, by including the period from 1998-2007.
Great stuff, keep it up!
Strongs
Peter Guenther
Welcome to the discussion, Strongs. My two cents regarding whether the system will continue to work:
- of course, nobody can predict this with certainty
- one thing to consider: The critical component of the system in my view is not the bond side, but the equity side. You need to make a great selection here for the system to perform. For example, see our discussions in Amazing returns = superior stock selection strategy + superior in & out strategy.
- currently, bonds are going down since inflation and interest expectations are increasing (= economic recovery expectations). Currently, the algo is in equity not in bonds. When the algo does a solid job, then we only go in bonds when there is (substantial) jitter in the equity market. Jitter could occur because of doubts concerning the speed of the economic recovery. When there are these kinds of doubts, then bond prices will increase (= yields will fall) and, if the system switches accurately, we will benefit from this uptick to some extent.
Emiliano Fraticelli
Hi everybody! I deployed a slightly modified version of the algorithm for a client on IBKR US. But the client had an error some days ago and the strategy stopped.
https://i.ibb.co/zPvLKfW/stopped-algo.pngCan anyone suggest the reason?
Thanks
Tentor Testivis
The material on this website is provided for informational purposes only and does not constitute an offer to sell, a solicitation to buy, or a recommendation or endorsement for any security or strategy, nor does it constitute an offer to provide investment advisory services by QuantConnect. In addition, the material offers no opinion with respect to the suitability of any security or specific investment. QuantConnect makes no guarantees as to the accuracy or completeness of the views expressed in the website. The views are subject to change, and may have become unreliable for various reasons, including changes in market conditions or economic circumstances. All investments involve risk, including loss of principal. You should consult with an investment professional before making any investment decisions.
To unlock posting to the community forums please complete at least 30% of Boot Camp.
You can continue your Boot Camp training progress from the terminal. We hope to see you in the community soon!