Backtesting
Debugging
Introduction
The debugger is a built-in tool to help you debug coding errors while backtesting. The debugger enables you to slow down the code execution, step through the program line-by-line, and inspect the variables to understand the internal state of the program.
Local debugging only works with local projects. Locally debugging cloud projects is not currently supported.
Requirements
You need to install v2023.4.0 of Microsoft's Python VS Code extension to run the debugger.
You need to install .NET and Microsoft's C# VS Code extension to run the debugger.
Breakpoints
Breakpoints are lines in your algorithm where execution pauses. You need at least one breakpoint in your code files to start the debugger. Open a project to start adjusting its breakpoints.
Add Breakpoints
Click to the left of a line number to add a breakpoint on that line.
Edit Breakpoint Conditions
Follow these steps to customize what happens when a breakpoint is hit:
- Right-click the breakpoint and then click .
- Click one of the options in the following table:
| Option | Additional Steps | Description |
|---|---|---|
| Enter an expression and then press Enter. | The breakpoint only pauses the algorithm when the expression is true. | |
| Enter an integer and then press Enter. | The breakpoint doesn't pause the algorithm until its hit the number of times you specify. |
Enable and Disable Breakpoints
To enable a breakpoint, right-click it and then click .
To disable a breakpoint, right-click it and then click .
Follow these steps to enable and disable all breakpoints:
- In the left navigation menu, click the
 Run and Debug icon.
 - In the Run and Debug panel, hover over the Breakpoints section and then click the
 Toggle Active Breakpoints icon.
Remove Breakpoints
To remove a breakpoint, right-click it and then click .
Follow these steps to remove all breakpoints:
- In the left navigation menu, click the Run and Debug icon.
- In the Run and Debug panel, hover over the Breakpoints section and then click the
 Remove All Breakpoints icon.
Launch Debugger
Follow these steps to launch the debugger:
- Open the project you want to debug.
- In your project's code files, add at least one breakpoint.
- Click the
 Debug icon.
If the Run and Debug panel is not open, it opens when the first breakpoint is hit.
Control Debugger
After you launch the debugger, you can use the following buttons to control it:
| Button | Name | Default Keyboard Shortcut | Description |
|---|---|---|---|
 | Continue | Continue execution until the next breakpoint | |
 | Step Over | Alt+F10 | Step to the next line of code in the current or parent scope |
 | Step Into | Alt+F11 | Step into the definition of the function call on the current line |
 | Restart | Shift+F11 | Restart the debugger |
 | Disconnect | Shift+F5 | Exit the debugger |
Inspect Variables
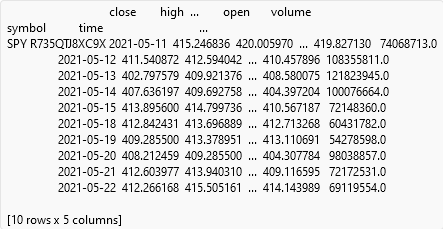
After you launch the debugger, you can inspect the state of your algorithm as it executes each line of code. You can inspect local variables or custom expressions. The values of variables in your algorithm are formatted in the IDE to improve readability. For example, if you inspect a variable that references a DataFrame, the debugger represents the variable value as the following:
Local Variables
The Variables section of the Run and Debug panel shows the local variables at the current breakpoint. If a variable in the panel is an object, click it to see its members. The panel updates as the algorithm runs.
Follow these steps to update the value of a variable:
- In the Run and Debug panel, right-click a variable and then click .
- Enter the new value and then press Enter.
Custom Expressions
The Watch section of the Run and Debug panel shows any custom expressions you add. For example, you can add an expression to show the current date in the backtest.
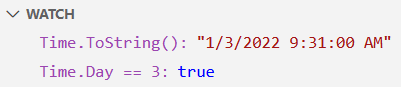
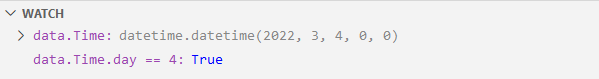
Follow these steps to add a custom expression:
- Hover over the Watch section and then click the plus icon that appears.
- Enter an expression and then press Enter.
You can also see our Videos. You can also get in touch with us via Discord.
Did you find this page helpful?