Optimization
Results
View Optimization Results
The optimization results page automatically displays when you launch an optimization job. The page presents the algorithm's equity curves, parameters, target values, server statistics, and much more information.
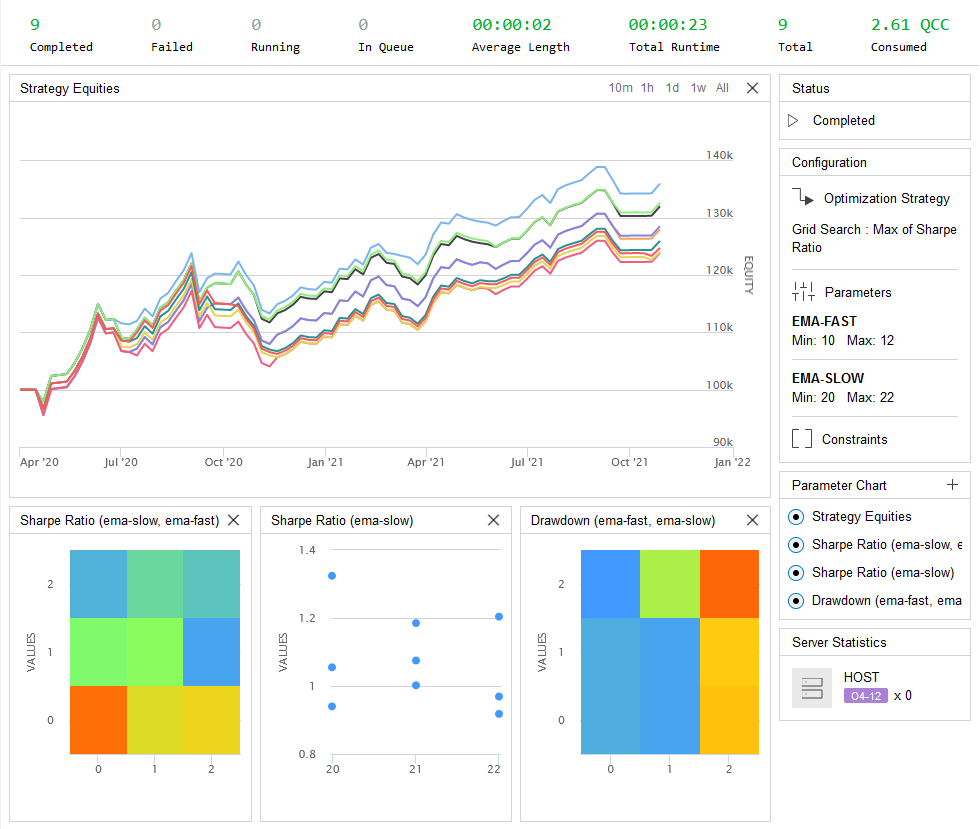
The content in the optimization results page updates as your optimization job executes. You can close or refresh the window without interrupting the job because the optimization nodes process on our servers. If you close the page, you can view all of the project's optimizations to open the page again.
Runtime Statistics
The banner at the top of the optimization results page displays the performance statistics of the optimization job.

The banner updates in real-time as the optimization job progresses on our servers. The following table describes the runtime statistics:
| Statistic | Description |
|---|---|
| Completed | The number of backtests that have successfully completed |
| Failed | The number of backtests that have failed during execution |
| Running | The number of backtests that are currently running |
| In Queue | The number of backtests that are waiting to start |
| Average Length | The average amount of time to complete one of the backtests |
| Total Runtime | The total runtime of the optimization job |
| Total | The total number of backtests run in the optimization job |
| Consumed | The amount of QuantConnect Credit that was used to perform the optimization |
Equity Curves
The optimization results page displays a Strategy Equities chart so that you can analyze the equity curves of the individual backtests in the optimization job.
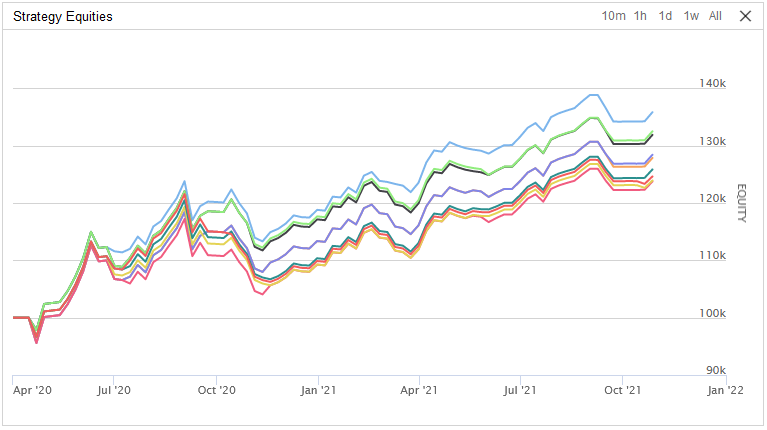
The equity curves of the backtests update in real-time as the optimization job runs. View the Strategy Equities chart to see how the parameter values affect the equity of your algorithm, to see how sensitive the returns are to the range of parameters selected by the optimizer, and to take a closer look at specific times in the backtest history.
Parameter Charts
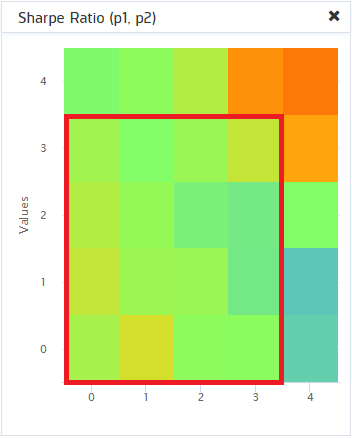
The optimization results page displays parameter charts to show the relationship between the parameter value(s) selected by the optimizer and the value of several objectives. If your optimization job has one parameter, the result page displays a scatter plot for each objective. If your optimization job has two parameters, the result page displays a heat map for each objective.
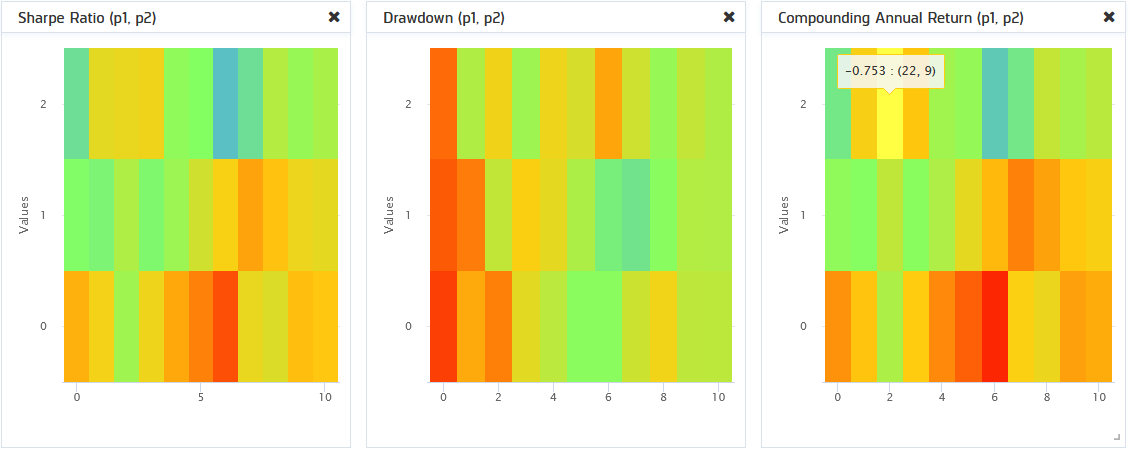
If your optimization job has three parameters, the result page displays a 3-dimensional plot for each objective. To analyze the results of 3-dimensional plots, you can rotate them and apply cuttoff values. To get the objective value for a combination of parameters, hover over the dots in the plot.
Parameter Stability
Zones in the heatmap where the color of adjacent cells are relatively consistent represent areas where the objectives are stable. In these areas, the value of the objectives is not significantly influenced by the parameter values. The following image shows the parameter chart of an optimization job. The highlighted area identifies combinations of parameter values that stabilize the objective function.
Supported Objectives
You can add parameter charts for the following objectives:
- Alpha
- Annual Standard Deviation
- Annual Variance
- Average Loss
- Average Win
- Beta
- Compounding Annual Return
- Drawdown
- Estimated Strategy Capacity
- Expectancy
- Information Ratio
- Loss Rate
- Net Profit
- Probabilistic Sharpe Ratio (PSR)
- Profit-Loss Ratio
- Sharpe Ratio
- Total Fees
- Total Trades
- Tracking Error
- Treynor Ratio
- Win Rate
Add Parameter Charts
Follow these steps to add a parameter chart to the optimization results page:
- In the Parameter Chart panel, click the plus icon.
- Click the Objective field and then select an objective from the drop-down menu.
- Click the Parameter 1 field and then select a parameter from the drop-down menu.
- If there are multiple parameters in the optimization, click the Parameter 2 field and then select a parameter from the drop-down menu.
- If there are three parameters in the optimization, click the Parameter 3 field and then select a parameter from the drop-down menu.
- Click .
The optimization results page displays the new chart.
Individual Backtest Results
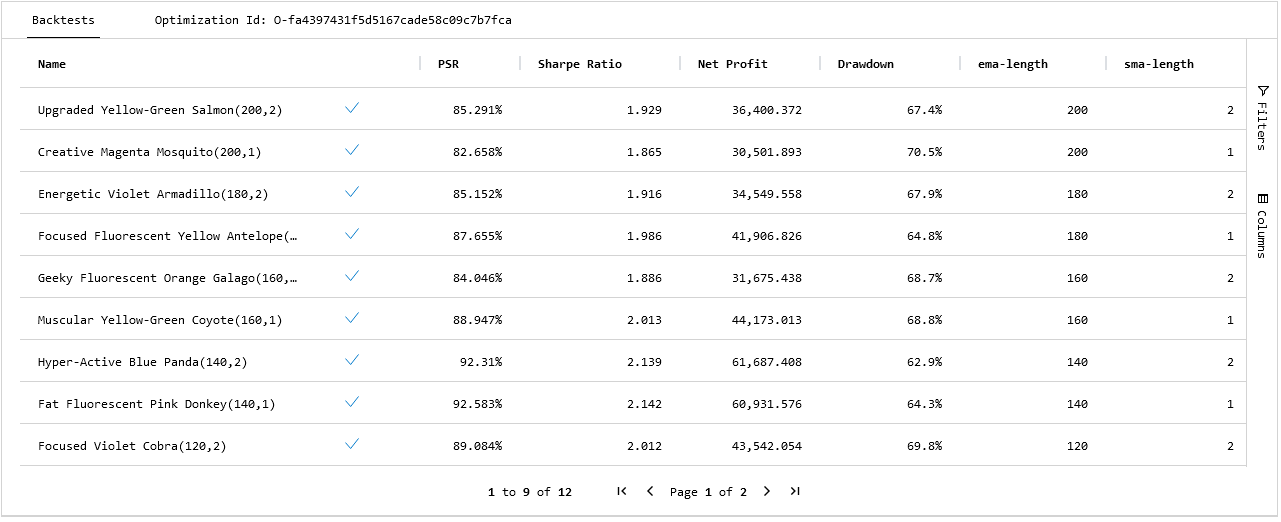
The optimization results page displays a Backtests table that includes all of the backtests that ran during the optimization job. The table lists the parameter values of the backtests in the optimization job and their resulting values for the objectives.
Open the Backtest Results Page
To open the backtest result page of one of the backtests in the optimization job, click a backtest in the table.
Download the Table
To download the table, right-click one of the rows, and then click .
Filter the Table
Follow these steps to apply filters to the Backtests table:
- On the right edge of the Backtests table, click .
- Click the name of the column to which you want the filter to be applied.
- If the column you selected is numerical, click the operation field and then select one of the operations from the drop-down menu.
- Fill the fields below the operation you selected.
Toggle Table Columns
Follow these steps to hide and show columns in the Backtests table:
- On the right edge of the Backtests table, click .
- Select the columns you want to include in the Backtests table and deselect the columns you want to exclude.
Sort the Table Columns
In the Backtests table, click one of the column names to sort the table by that column.
Server Stats
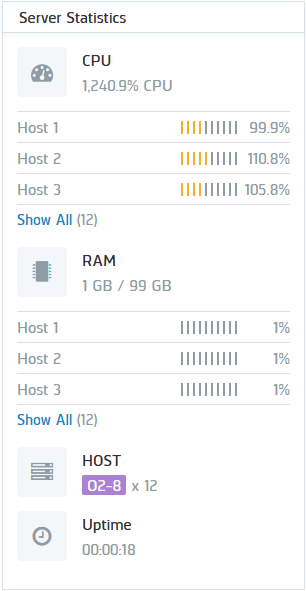
The optimization results page displays a Server Statistics section to show the status of the nodes running the optimization job.
The following image shows an example of the Server Statistics section:
The following table describes the information that the Server Statistics section displays:
| Property | Description |
|---|---|
| CPU | The total CPU usage and the CPU usage of each node |
| RAM | The total RAM usage of the RAM usage of each node |
| HOST | The node model and the number of nodes used to run the optimization |
| Uptime | The length of time that the optimization job has ran |
View the Server Statistics section to see the amount of CPU power and RAM the optimization job demands. If your algorithm is demanding a lot of resources, use more powerful nodes on the next optimization job or improve the efficiency of your algorithm.
Errors
The following table describes common optimization errors:
| Error | Description |
|---|---|
| Runtime Errors | If a backtest in your optimization job throws a runtime error, the backtest will not complete but you will still be charged. |
| Data Overload | If a backtest in your optimization job produces more than 700MB of data, then Lean can't upload the results and the optimization job appears to never be complete. |
View All Optimizations
Follow these steps to view all of the optimization results of a project:
- Open the project that contains the optimization results you want to view.
- At the top of the IDE, click the
 Results icon.
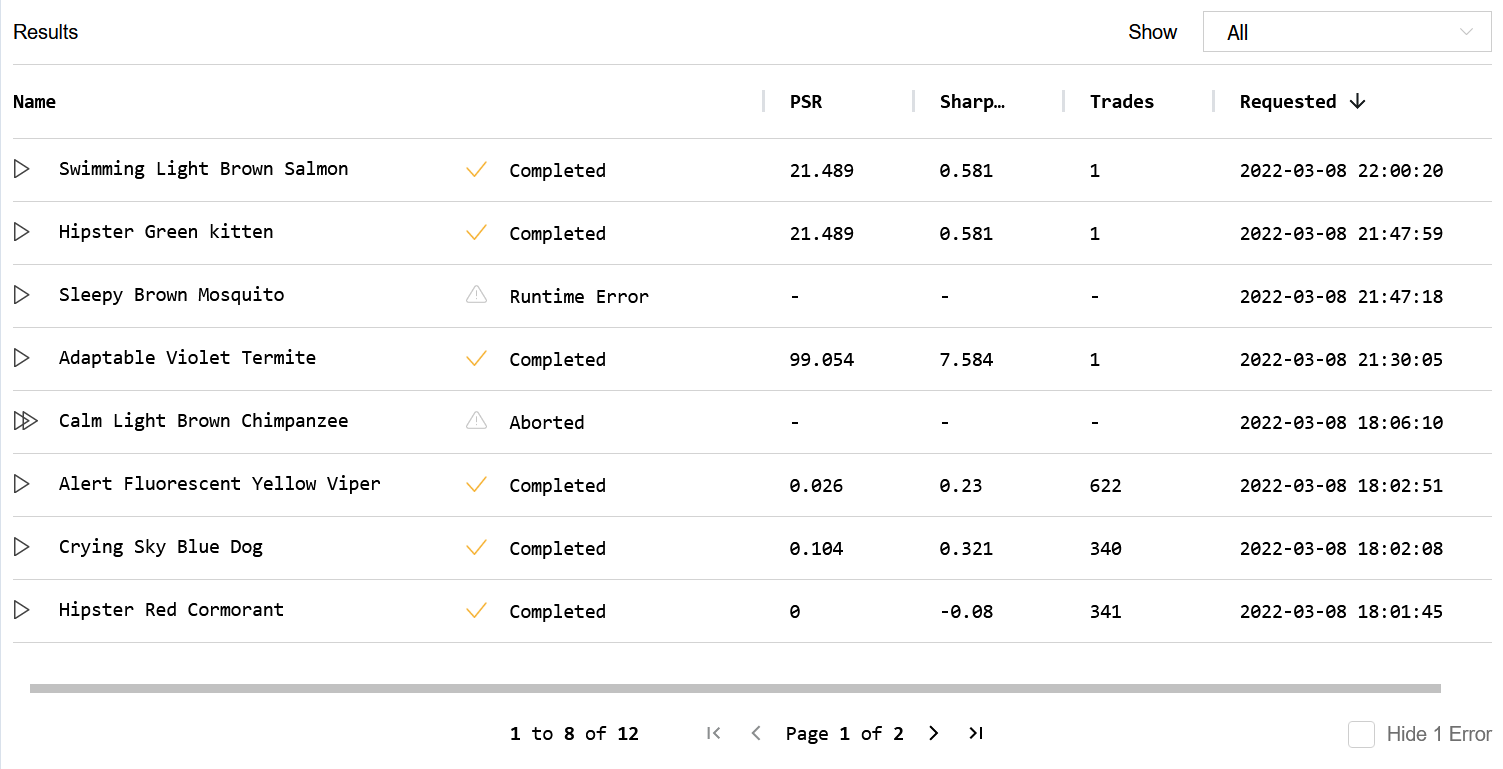
 - (Optional) In the top-right corner, select the Show field and then select one of the options from the drop-down menu to filter the table by backtest or optimization results.
- (Optional) In the bottom-right corner, click the Hide Error check box to remove backtest and optimization results from the table that had a runtime error.
- (Optional) Use the pagination tools at the bottom to change the page.
- (Optional) Click a column name to sort the table by that column.
- Click a row in the table to open the results page of that backtest or optimization.
A table containing all of the backtest and optimization results for the project is displayed. If there is a play icon to the left of the name, it's a backtest result. If there is a fast-forward icon next to the name, it's an optimization result.
Rename Optimizations
We give an arbitrary name (for example, "Smooth Apricot Chicken") to your optimization result files, but you can follow these steps to rename them:
- Hover over the optimization you want to rename and then click the pencil icon that appears.
- Enter the new name and then press Enter.

Delete Optimizations
Hover over the optimization you want to delete and then click the trash can icon that appears to delete the optimization result.

You can also see our Videos. You can also get in touch with us via Discord.
Did you find this page helpful?