Backtesting
Results
View Backtest Results
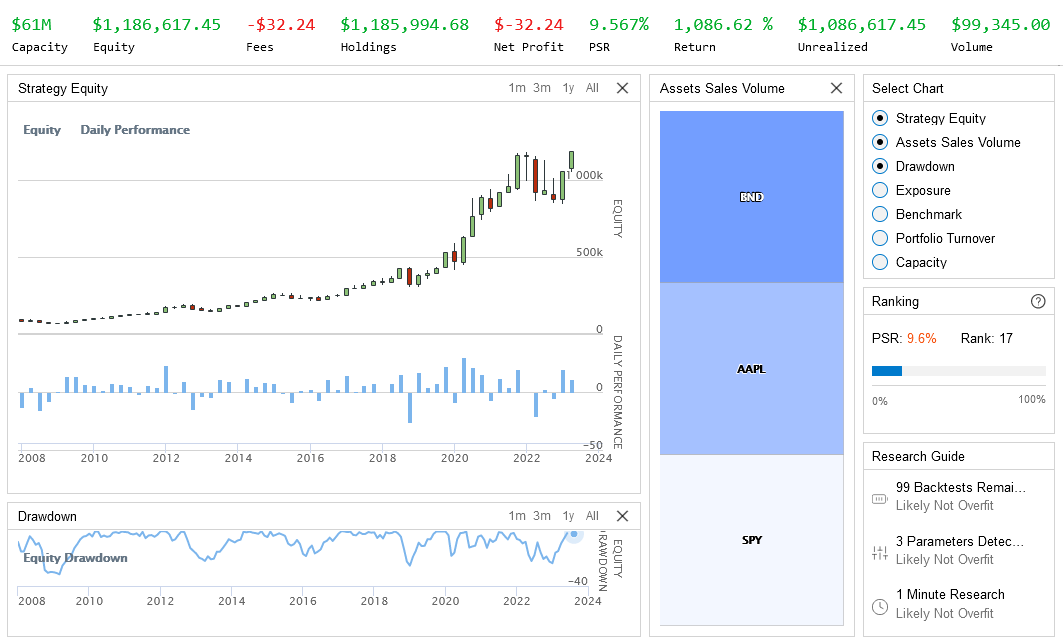
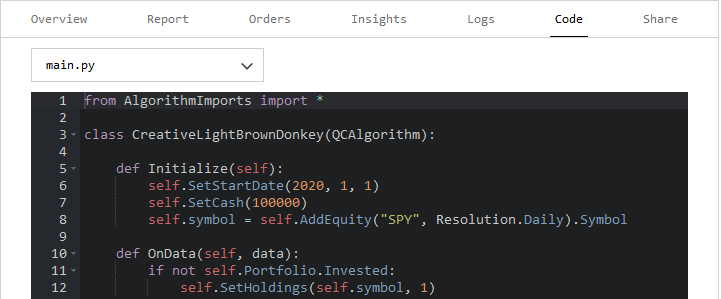
The backtest results page automatically displays when you deploy a backtest. The backtest results page presents the equity curve, trades, logs, performance statistics, and much more information.
The content in the backtest results page updates as your backtest executes. You can close or refresh the window without interrupting the backtest because the backtesting node processes on our servers. If you close the page, to open the page again, view all of the project's backtests. Unless you explicitly make the backtest public, only you can view its results. If you delete a backtest result or you are inactive for 12 months, we archive your backtest results.
Runtime Statistics
The banner at the top of the backtest results page displays the runtime statistics of your backtest.

The following table describes the default runtime statistics:
| Statistic | Description |
|---|---|
| Equity | The total portfolio value if all of the holdings were sold at current market rates. Equity equals the sum of cash and the market value of all open positions. |
| Fees | The total quantity of fees paid for all the transactions during the algorithm's trading period. Total fees include brokerage commissions, exchange fees, and other transaction costs. |
| Holdings | The absolute sum of the items in the portfolio. Holdings represent the total market value of all positions, regardless of whether they are long or short. |
| Net Profit | The dollar-value return across the entire trading period. |
| PSR | The probability that the estimated Sharpe ratio of an algorithm is greater than a benchmark. |
| Return | The rate of return across the entire trading period. |
| Unrealized | The amount of profit a portfolio would capture if it liquidated all open positions and paid the fees for transacting and crossing the spread. Unrealized profit becomes realized profit when the positions are closed. |
| Volume | The total value of assets traded for all of an algorithm's transactions during the trading period. |
To download the runtime statistics data, see Download Results.
To add a custom runtime statistic, see Add Statistics.
Built-in Charts
The backtest results page displays a set of built-in charts to help you analyze the performance of your algorithm. The following table describes the charts displayed on the page:
| Chart | Description |
|---|---|
| Strategy Equity | A time series of equity and periodic returns. |
| Capacity | A time series of strategy capacity snapshots. |
| Drawdown | A time series of equity peak-to-trough value. |
| Benchmark | A time series of the benchmark closing price (SPY, by default). |
| Exposure | A time series of long and short exposure ratios. |
| Assets Sales Volume | A chart showing the proportion of total volume for each traded security. |
| Portfolio Turnover | A time series of the portfolio turnover rate. |
| Portfolio Margin | A stacked area chart of the portfolio margin usage. For more information about this chart, see Portfolio Margin Plots. |
| Performance | Time series of various performance metrics. For more information about this chart, see Performance Chart. |
| Asset Plot | A time series of an asset's price with order event annotations. These charts are available for all paid organziation tiers. For more information about these charts, see Asset Plots. |
To download the chart data, see Download Results.
Performance Chart
Performance chart displays series of metrics to help you analyze the computational performance of your algorithm for code optimization purposes. The following table describes the series displayed on the chart:
| Series | Description |
|---|---|
| CPU | Total CPU usage as a percentage. |
| ManagedRAM | RAM used on the machine. |
| TotalRAM | Amount of private memory allocated for the current process (includes both managed and unmanaged memory). |
| ActiveSecurities | The number of active securities. An active security is a security that is currently selected by the universe or has holdings or open orders. |
| DataPoints | The number of data points processed per second. |
| HistoryDataPoints | The number of data points of algorithm history provider. |
| Subscriptions | The total execution time reading data subscriptions, measured in seconds, recorded since the last sampling event. |
| Selection | The total execution time adding and removing securities of universe selection, measured in seconds, recorded since the last sampling event. It includes the time spent in universe selection functions. |
| Slice | The total creation time of a time slice, measured in seconds, recorded since the last sampling event. The Slice object contains the data used to update the algorithm state. |
| Schedule | The total execution time of scheduled events, measured in seconds, recorded since the last sampling event. |
| Consolidators | The total execution time of data consolidation events, measured in seconds, recorded since the last sampling event. It includes the time spent updating indicators and executing consolidator handlers. |
| Securities | The total execution time of security updates, measured in seconds, recorded since the last sampling event. It includes the time spent in security change events and symbol change events. |
| Transactions | The total execution time of order events, measured in seconds, recorded since the last sampling event. For example, processing order fills, cancellations, and updates such as moving trailing stops. It includes the time spent in order events handlers. |
| SplitsDividendsDelisting | The total execution time of corporate action events, measured in seconds, recorded since the last sampling event. |
| OnData | The total execution time of OnDataon_data method call and Alpha.Updatealpha.update, measured in seconds, recorded since the last sampling event. |
The Performance chart is disabled by default. To enable this chart, set the Settings.PerformanceSamplePeriod propertyself.settings.performance_sample_period attribute to the desired sampling period:
Settings.PerformanceSamplePeriod = TimeSpan.FromDays(7);
self.settings.performance_sample_period = timedelta(7)
Asset Plots
Asset plots display the trade prices of an asset and the following order events you have for the asset:
| Order Event | Icon |
|---|---|
| Submissions | Gray circle |
| Updates | Blue circle |
| Cancellations | Gray square |
| Fills and partial fills | Green (buys) or red (sells) arrows |
The following image shows an example asset plot for AAPL:
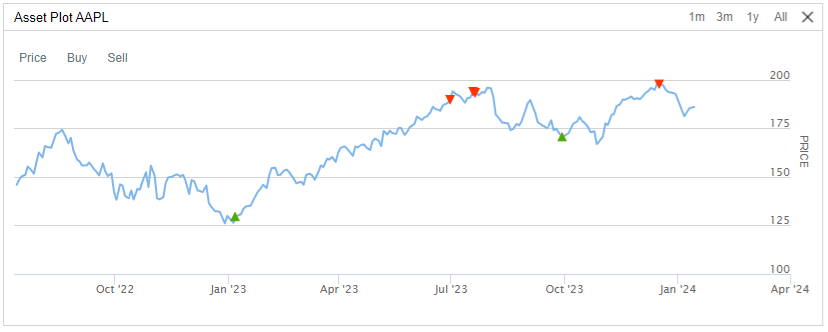
The order submission icons aren't visible by default.
View Plots
Follow these steps to open an asset plot:
- Open the backtest results page.
- Click the Orders tab.
- Click the
 Asset Plot icon that's next to the asset Symbol in the Orders table.
Tool Tips
When you hover over one of the order events in the table, the asset plot highlights the order event, displays the asset price at the time of the event, and displays the tag associated with the event. Consider adding helpful tags to each order event to help with debugging your algorithm. For example, when you cancel an order, you can add a tag that explains the reason for cancelling it.
Adjust the Display Period
The resolution of the asset price time series in the plot doesn't necessarily match the resolution you set when you subscribed to the asset in your algorithm. If you are displaying the entire price series, the series usually displays the daily closing price. However, when you zoom in, the chart will adjust its display period and may use higher resolution data. To zoom in and out, perform either of the following actions:
- Click the , , , or period in the top-right corner of the chart.
- Click a point on the chart and drag your mouse horizontally to highlight a specific period of time in the chart.
If you have multiple order events in a single day and you zoom out on the chart so that it displays the daily closing prices, the plot aggregates the order event icons together as the price on that day.
Order Fill Prices
The plot displays fill order events at the actual fill price of your orders. The fill price is usually not equal to the asset price that displays because of the following reasons:
- Your order experiences slippage.
- If you use quote data, your order fills at the bid or ask price.
- The fill model may fill your order at the high or low price.
Custom Charts
The results page shows the custom charts that you create.
Supported Chart Types
We support the following types of charts:
If you use SeriesType.Candle and plot enough values, the plot displays candlesticks. However, the Plotplot method only accepts one numerical value per time step, so you can't plot candles that represent the open, high, low, and close values of each bar in your algorithm. The charting software automatically groups the data points you provide to create the candlesticks, so you can't control the period of time that each candlestick represents.
To create other types of charts, save the plot data in the Object Store and then load it into the Research Environment. In the Research Environment, you can create other types of charts with third-party charting packages.
Supported Markers
When you create scatter plots, you can set a marker symbol. We support the following marker symbols:
Chart Quotas
Intensive charting requires hundreds of megabytes of data, which is too much to stream online or display in a web browser. The number of series and the number of data points per series you can plot depends on your organization tier. The following table shows the quotas:
| Tier | Max Series | Max Data Points per Series |
|---|---|---|
| Free | 10 | 4,000 |
| Quant Researcher | 10 | 8,000 |
| Team | 25 | 16,000 |
| Trading Firm | 25 | 32,000 |
| Institution | 100 | 96,000 |
If you exceed the series quota, your algorithm stops executing and the following message displays:
If you exceed the data points per series quota, the following message displays:
If your plotting needs exceed the preceding quotas, create the plots in the Research Environment instead.
Demonstration
For more information about creating custom charts, see Charting.
Adjust Charts
You can manipulate the charts displayed on the backtest results page.
Toggle Charts
To display and hide a chart on the backtest results page, in the Select Chart section, click the name of a chart.
Toggle Chart Series
To display and hide a series on a chart on the backtest results page, click the name of a series at the top of a chart.
Adjust the Display Period
To zoom in and out of a time series chart on the backtest results page, perform either of the following actions:
- Click the , , , or period in the top-right corner of the chart.
- Click a point on the chart and drag your mouse horizontally to highlight a specific period of time in the chart.
If you adjust the zoom on a chart, it affects all of the charts.
After you zoom in on a chart, slide the horizontal bar at the bottom of the chart to adjust the time frame that displays.
Resize Charts
To resize a chart on the backtest results page, hover over the bottom-right corner of the chart. When the resize cursor appears, hold the left mouse button and then drag to the desired size.
Move Charts
To move a chart on the backtest results page, click, hold, and drag the chart title.
Refresh Charts
Refreshing the charts on the backtest results page resets the zoom level on all the charts. If you refresh the charts while your algorithm is executing, only the data that was seen by the Lean engine after you refreshed the charts is displayed. To refresh the charts, in the Select Chart section, click the reset icon.
Key Statistics
The backtest results page displays many key statistics to help you analyze the performance of your algorithm.
Overall Statistics
The Overview tab on the backtest results page displays tables for Overall Statistics and Rolling Statistics. The Overall Statistics table displays the following statistics:
- Probabilistic Sharpe Ratio (PSR)
- Total Trades
- Average Loss
- Drawdown
- Net Profit
- Loss Rate
- Profit-Loss Ratio
- Beta
- Annual Variance
- Tracking Error
- Total Fees
- Lowest Capacity Asset
- Sharpe Ratio
- Average Win
- Compounding Annual Return
- Expectancy
- Win Rate
- Alpha
- Annual Standard Deviation
- Information Ratio
- Treynor Ratio
- Estimated Strategy Capacity
Some of the preceding statistics are sampled throughout the backtest to produce a time series of rolling statistics. The time series are displayed in the Rolling Statistics table.
To download the data from the Overall Statistics and Rolling Statistics tables, see Download Results.
Research Guide
For information about the Research Guide, see Research Guide.
Reports
Backtest reports provide a summary of your algorithm's performance during the backtest period. Follow these steps to generate one:
- Open the backtest results page for which you want to generate a report.
- Click the Report tab.
- If the project doesn't have a description, enter one and then click .
- Click .
- If the IDE says that the report is being generated, repeat step 4.
The report may take a minute to generate.
Orders
The backtest results page displays the orders of your algorithm and you can download them to your local machine.
View in the GUI
To see the orders that your algorithm created, open the backtest results page and then click the Orders tab. If there are more than 10 orders, use the pagination tools at the bottom of the Orders Summary table to see all of the orders. Click on an individual order in the Orders Summary table to reveal all of the order events, which include:
- Submissions
- Fills
- Partial fills
- Updates
- Cancellations
- Option contract exercises and expiration
The timestamps in the Order Summary table are based in Eastern Time (ET).
Access the Order Summary CSV
To view the orders data in CSV format, open the backtest results page, click the Orders tab, and then click . The content of the CSV file is the content displayed in the Orders Summary table when the table rows are collapsed. The timestamps in the CSV file are based in Coordinated Universal Time (UTC).
Access the Orders JSON
To view all of the content in the Orders Summary table, see Download Results.
Access in Jupyter Notebooks
To programmatically analyze orders, call the ReadBacktestOrdersread_backtest_orders method or the /backtests/orders/read endpoint.
Trades
The backtest results page displays the closed trades of your algorithm and you can download them to your local machine. You can set how orders are combined to define a trade. For more information, see Trade Statistics
View in the GUI
To see the trades that your algorithm created, open the backtest results page and then click the Trades tab. If there are more than 10 trades, use the pagination tools at the bottom of the Trades Summary table to see all of the orders. Click on an individual trade in the Trades Summary table to reveal the order fills of the trade.
The timestamps in the Trades Summary table are based in Eastern Time (ET).
Access the Trade Summary CSV
To view the trades data in CSV format, open the backtest results page, click the Trades tab, and then click . The content of the CSV file is the content displayed in the Trades Summary table when the table rows are collapsed. The timestamps in the CSV file are based in Coordinated Universal Time (UTC).
Access the Trades JSON
To view all of the content in the Trades Summary table, see Download Results.
Insights
The backtest results page displays the insights of your algorithm and you can download them to your local machine.
View in the GUI
To see the insights your algorithm emit, open the backtest result page and then click the Insights tab. If there are more than 10 insights, use the pagination tools at the bottom of the Insights Summary table to see all of the insights. The timestamps in the Insights Summary table are based in Eastern Time (ET).
Download JSON
To view the insights in JSON format, open the backtest result page, click the Insights tab, and then click . The timestamps in the CSV file are based in Coordinated Universal Time (UTC).
Logs
The backtest results page displays the logs of your backtest and you can download them to your local machine. The timestamps of the statements in the log file are based in your algorithm time zone.
View in the GUI
To see the log file that was created throughout a backtest, open the backtest result page and then click the Logs tab.
To filter the logs, enter a search string in the Filter logs field.
Download Log Files
To download the log file that was created throughout a backtest, follow these steps:
- Open the backtest result page.
- Click the Logs tab.
- Click .
Share Results
The backtest results page enables you to share your backtest results. You need to make a backtest public in order to share it. To make a backtest public, in the Share Results section of the backtest results page, click . Once you make a backtest public, click to copy a link to the backtest result or click to copy an iframe HTML element you can embed on a website.
The following widget is an example of an embedded backtest result:
To attach the embedded backtest result to a forum discussion, see Create Discussions or Post Comments.
After you've made your backtest results public, the results are always stored and anyone with the link can access the results. To make your backtest results private again, click .
Download Results
You can download the following information from the backtest results page:
- Runtime statistics
- Charts
- The data in the Overview tab
- The data in the Orders tab
To download the preceding information, open the backtest results page, click the Overview tab, and then click . The timestamps in the file are based in Coordinated Universal Time (UTC).
The information is stored in JSON format. The following code converts the JSON result file into CSV format.
using System;
using System.Collections.Generic;
using System.Data;
using System.IO;
using Newtonsoft.Json;
using Newtonsoft.Json.Linq;

static DataTable CreateMultiIndexDataTable(JObject jsonObject)
{
    DataTable dataTable = new DataTable();
    dataTable.Columns.Add("Key Path");
    dataTable.Columns.Add("Value");

    // Flatten the JSON and populate the DataTable.
    FlattenJson(jsonObject, dataTable, string.Empty);

    return dataTable;
}

static void FlattenJson(JToken json, DataTable dataTable, string parentKey)
{
    foreach (var property in json.Children<JProperty>())
    {
        string currentKey = string.IsNullOrEmpty(parentKey) ? property.Name : $"{parentKey}.{property.Name}";

        if (property.Value.Type == JTokenType.Object)
        {
            FlattenJson(property.Value, dataTable, currentKey);
        }
        else if (property.Value.Type == JTokenType.Array)
        {
            for (int i = 0; i < property.Value.Count(); i++)
            {
                FlattenJson(property.Value[i], dataTable, $"{currentKey}[{i}]");
            }
        }
        else
        {
            dataTable.Rows.Add(currentKey, property.Value.ToString());
        }
    }
}

static void WriteDataTableToCsv(DataTable dataTable, string filePath)
{
    using (StreamWriter writer = new StreamWriter(filePath))
    {
        // Write header.
        writer.WriteLine(string.Join(",", dataTable.Columns));

        // Write rows.
        foreach (DataRow row in dataTable.Rows)
        {
            writer.WriteLine(string.Join(",", row.ItemArray));
        }
    }
}

// Load the JSON file.
string jsonData = File.ReadAllText("<YOUR_JSON_FILE>.json");
var jsonObject = JsonConvert.DeserializeObject<JObject>(jsonData);

// Create a DataTable to hold the multi-index structure.
DataTable dataTable = CreateMultiIndexDataTable(jsonObject);

// Save to CSV.
WriteDataTableToCsv(dataTable, "results.csv");
import json
import pandas as pd
# Load the JSON file.
data = json.loads(open("<YOUR_JSON_FILE>.json", "r", encoding="utf-8").read())
# Recursive function to flatten the JSON and create tuples for multi-index.
def flatten_json(obj, parent_key='', sep='_'):
items = []
for k, v in obj.items():
new_key = f"{parent_key}{sep}{k}" if parent_key else k
if isinstance(v, dict):
items.extend(flatten_json(v, new_key, sep=sep).items())
else:
items.append((new_key, v))
return dict(items)
# Flatten the JSON data.
flat_data = flatten_json(data)
# Split keys into a list for multi-index.
multi_index_tuples = [tuple(k.split('_')) for k in flat_data.keys()]
values = list(flat_data.values())
# Create the multi-index DataFrame.
multi_index = pd.MultiIndex.from_tuples(multi_index_tuples)
df = pd.DataFrame(values, index=multi_index, columns=['Value'])
# Save to CSV.
df.to_csv('results.csv')
View All Backtests
Follow these steps to view all of the backtests of a project:
- Open the project that contains the backtests you want to view.
- In the top-right corner of the IDE, click the
 Backtest Results icon.
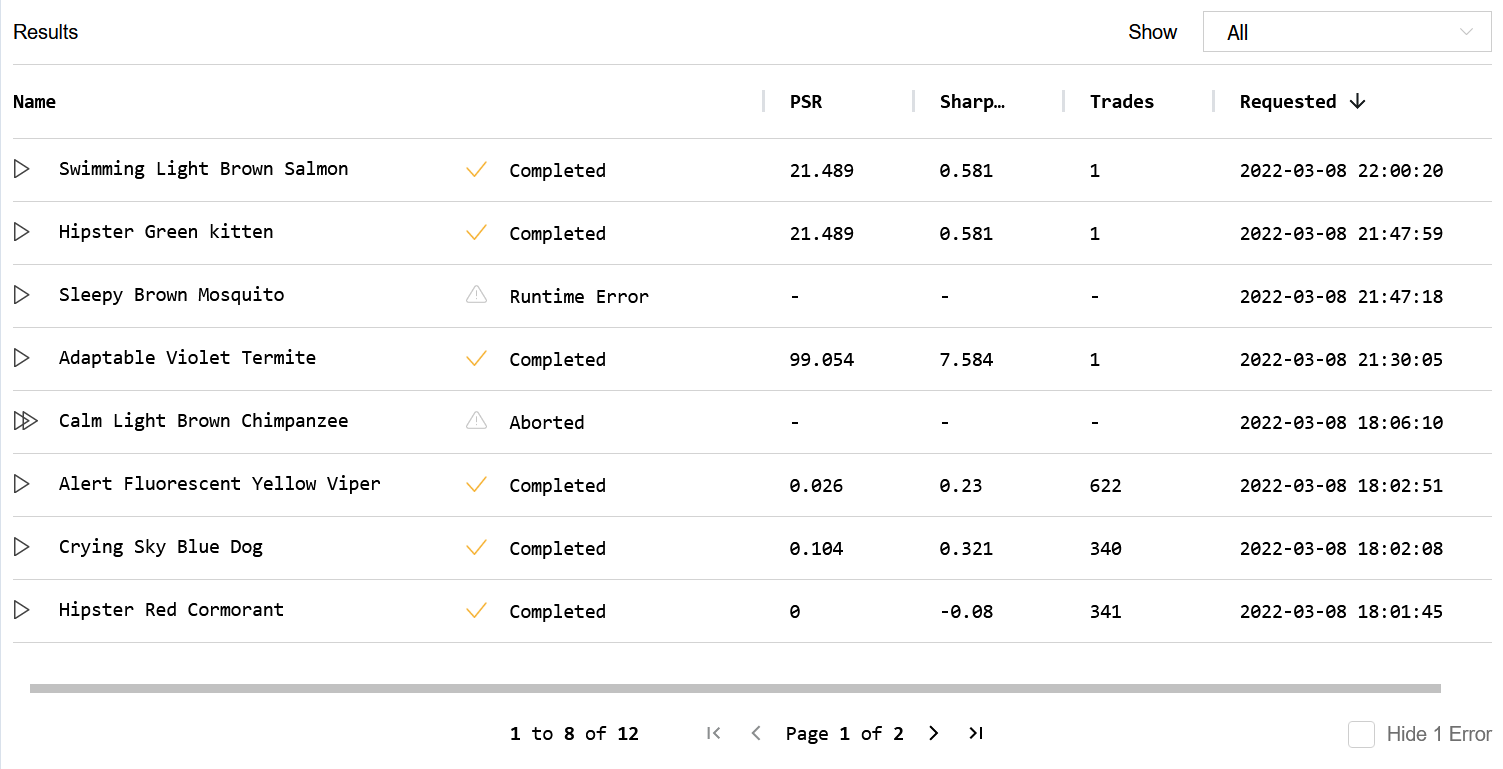
 - (Optional) In the top-right corner, select the Show field and then select one of the options from the drop-down menu to filter the table by backtest or optimization results.
- (Optional) In the bottom-right corner, click the Hide Error check box to remove backtest and optimization results from the table that had a runtime error.
- (Optional) Use the pagination tools at the bottom to change the page.
- (Optional) Click a column name to sort the table by that column.
- Click a row in the table to open the results page of that backtest or optimization.
A table containing all of the backtest results for the project is displayed. If there is a play icon to the left of the name, it's a backtest result. If there is a fast-forward icon next to the name, it's an optimization result.
Rename Backtests
We give an arbitrary name (for example, "Smooth Apricot Chicken") to your backtest result files, but you can follow these steps to rename them:
- Hover over the backtest you want to rename and then click the pencil icon that appears.
- Enter the new backtest name and then click .

To programmatically set the backtest name, call the SetNameset_name method.
SetName("Backtest Name"); self.set_name("Backtest Name")
For more information, see Set Name and Tags.
Clone Backtests
Hover over the backtest you want to clone, and then click the clone icon that appears to clone the backtest.

A new project is created with the backtest code files.
Delete Backtests
Hover over the backtest you want to delete, and then click the trash can icon that appears to delete the backtest.
Out of Sample Period
To reduce the chance of overfitting, organization managers can enforce all backtests must end a certain number of months before the current date. For example, if you set a one year out-of-sample period, the researchers on your team will not be able to use the most recent year of data in their backtests. A out-of-sample period is helpful because it leaves you a period to test your model after your done the development stage. Follow these steps to change the backtest out-of-sample period:
- Open the organization homepage.
- Scroll down to the Backtesting Out of Sample Period section.
- Adjust the out-of-sample period duration or click on "No Holdout Period".
You can also see our Videos. You can also get in touch with us via Discord.
Did you find this page helpful?