Indicators
Custom Indicators
Create Subscriptions
You need to subscribe to some market data in order to calculate indicator values.
var qb = new QuantBook();
var symbol = qb.AddEquity("SPY").Symbol;
qb = QuantBook()
symbol = qb.add_equity("SPY").symbol
Create Indicator Timeseries
You need to subscribe to some market data in order to calculate a timeseries of indicator values.
Follow these steps to create an indicator timeseries:
- Get some historical data.
- Define a custom indicator class that inherits from the
Indicatorsuperclass. - Define a custom indicator class. Note the
PythonIndicatorsuperclass inheritance,Valuevalueattribute, andUpdateupdatemethod are mandatory. - Initialize a new instance of the custom indicator.
- Create a
RollingWindowfor each attribute of the indicator to hold their values. - Attach a handler method to the indicator that updates the
RollingWindowobjects. - Iterate through the historical market data and update the indicator.
- Display the data.
- Populate a
DataFramewith the data in theRollingWindowobjects.
// Request historical trading data with the daily resolution.
var history = qb.History(symbol, 70, Resolution.Daily);
# Request historical trading data with the daily resolution.
history = qb.history[TradeBar](symbol, 70, Resolution.DAILY)
In this tutorial, create an ExpectedShortfallPercent indicator that uses Monte Carlo to calculate the expected shortfall of returns. Use the WindowIndicator superclass instead of Indicator for using a period of historical data stored in a RollingWindow.
In this tutorial, create an ExpectedShortfallPercent indicator that uses Monte Carlo to calculate the expected shortfall of returns.
public class ExpectedShortfallPercent : WindowIndicator<IndicatorDataPoint>, IIndicatorWarmUpPeriodProvider
{
    private decimal _alpha;

    // Set up IndicatorDataPoint attributes for the indicator.
    public IndicatorBase<IndicatorDataPoint> ValueAtRisk { get; }

    // Set up the WarmUpPeriod attribute to provide implementation of the IIndicatorWarmUpPeriodProvider interface.
    public override int WarmUpPeriod => Period;

    // Set up the constructor.
    // period: The lookback period for return distribution.
    // alpha: Alpha level of VaR cutoff.
    public ExpectedShortfallPercent(int period, decimal alpha)
        : base("ES", period)
    {
        _alpha = alpha;
        ValueAtRisk = new Identity("ES_VaR");
    }

    // Override the IsReady method to set up the flag of the Indicator and its IndicatorDataPoint attributes are ready.
    public override bool IsReady => ValueAtRisk.IsReady;

    // Mandatory: Override the ComputeNextValue method to calculate the indictor value.
    protected override decimal ComputeNextValue(IReadOnlyWindow<IndicatorDataPoint> window, IndicatorDataPoint input)
    {
        if (Samples < 2)
            return 0m;

        var n = Math.Min(Period, Samples);
        var cutoff = (int) Math.Ceiling(n * _alpha);

        var samples = new List<decimal>();
        for (int i = 0; i < window.Count - 1; i++)
        {
            samples.Add( (window[i] - window[i+1]) / window[i+1] );
        }
        var lowest = samples.OrderBy(x => x).Take(cutoff);

        ValueAtRisk.Update(input.Time, lowest.Last());
        return lowest.Average();
    }
}
class ExpectedShortfallPercent(PythonIndicator):
import math, numpy as np
def __init__(self, period, alpha):
self.value = None # Attribute represents the indicator value
self.value_at_risk = None
self.alpha = alpha
self._window = RollingWindow(period)
# Override the IsReady attribute to flag all attributes values are ready.
@property
def is_ready(self) -> bool:
return self.value and self.value_at_risk
# Method to update the indicator values. Note that it only receives 1 IBaseData object (Tick, TradeBar, QuoteBar) argument.
def update(self, input: BaseData) -> bool:
count = self._window.count
self._window.add(input.close)
# Update the Value and other attributes as the indicator current value.
if count >= 2:
cutoff = math.ceil(self.alpha * count)
ret = [ (self._window[i] - self._window[i+1]) / self._window[i+1] for i in range(count-1) ]
lowest = sorted(ret)[:cutoff]
self.value = np.mean(lowest)
self.value_at_risk = lowest[-1]
# return a boolean to indicate IsReady.
return count >= 2
var es = new ExpectedShortfallPercent(50, 0.05m);
custom = ExpectedShortfallPercent(50, 0.05)
In this example, save 20 data points.
// Create a window dictionary to store RollingWindow objects. var window = new Dictionary<string, RollingWindow<decimal>>(); // Store the RollingWindow objects, index by key is the property of the indicator. var time = new RollingWindow<DateTime>(20); window["expectedshortfall"] = new RollingWindow<decimal>(20); window["valueatrisk"] = new RollingWindow<decimal>(20);
# Create a window dictionary to store RollingWindow objects.
window = {}
# Store the RollingWindow objects, index by key is the property of the indicator.
window['time'] = RollingWindow(20)
window['expectedshortfall'] = RollingWindow(20)
window['valueatrisk'] = RollingWindow(20)
// Define an update function to add the indicator values to the RollingWindow object.
es.Updated += (sender, updated) =>
{
var indicator = (ExpectedShortfallPercent) sender;
time.Add(updated.EndTime);
window["expectedshortfall"].Add(updated);
window["valueatrisk"].Add(indicator.ValueAtRisk.Current);
};
When the indicator receives new data, the preceding handler method adds the new IndicatorDataPoint values into the respective RollingWindow.
foreach(var bar in history){
es.Update(bar.EndTime, bar.Close);
} for bar in history:
custom.update(bar)
# The Updated event handler is not available for custom indicator in Python, RollingWindows are needed to be updated in here.
if custom.is_ready:
window['time'].add(bar.end_time)
window['expectedshortfall'].add(custom.value)
window['valueatrisk'].add(custom.value_at_risk)
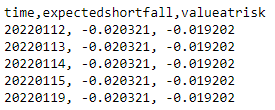
Console.WriteLine($"time,{string.Join(',', window.Select(kvp => kvp.Key))}");
foreach (var i in Enumerable.Range(0, 5).Reverse())
{
var data = string.Join(", ", window.Select(kvp => Math.Round(kvp.Value[i],6)));
Console.WriteLine($"{time[i]:yyyyMMdd}, {data}");
}
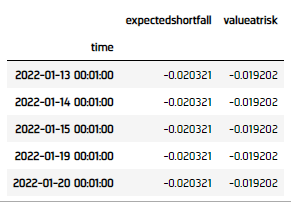
custom_dataframe = pd.DataFrame(window).set_index('time')
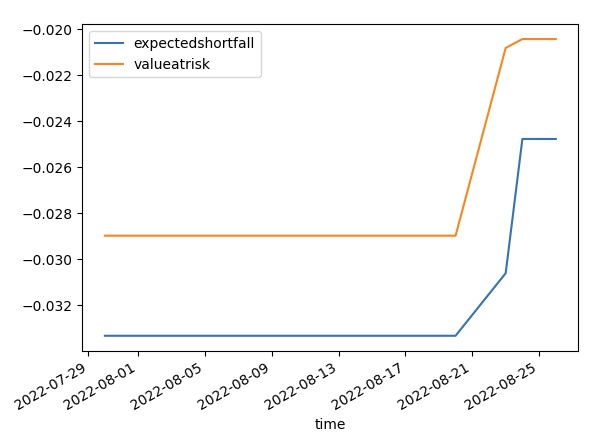
Plot Indicators
Jupyter Notebooks don't currently support libraries to plot historical data, but we are working on adding the functionality. Until the functionality is added, use Python to plot custom indicators.
Follow these steps to plot the indicator values:
- Call the
plotmethod. - Show the plot.
custom_dataframe.plot()
plt.show()
Examples
The following examples demonstrate some common practices for researching with combining indicators.
Example 1: Expected Shortfall
The following example demonstrates researching using a custom-constructed Expected Shortfall indicator. Expected Shortfall refers to the average of the N% worst-case return.
// Load the assembly files and data types in their own cell. #load "../Initialize.csx"
// Load the necessary assembly files. #load "../QuantConnect.csx" #r "nuget: Plotly.NET" #r "nuget: Plotly.NET.Interactive"
// Import the QuantConnect, Plotly.NET, and Accord packages for calculation and plotting.
using QuantConnect;
using QuantConnect.Indicators;
using QuantConnect.Research;
using Plotly.NET;
using Plotly.NET.Interactive;
using Plotly.NET.LayoutObjects;
// Instantiate the QuantBook instance for researching.
var qb = new QuantBook();
// Request SPY data to work with the indicator.
var symbol = qb.AddEquity("SPY").Symbol;
// Request historical trading data with the daily resolution.
var history = qb.History(symbol, 70, Resolution.Daily);
public class ExpectedShortfallPercent : WindowIndicator<IndicatorDataPoint>, IIndicatorWarmUpPeriodProvider
{
private decimal _alpha;
// Set up IndicatorDataPoint attributes for the indicator.
public IndicatorBase<IndicatorDataPoint> ValueAtRisk { get; }
// Set up the WarmUpPeriod attribute to provide implementation of the IIndicatorWarmUpPeriodProvider interface.
public override int WarmUpPeriod => Period;
// Set up the constructor.
// period: The lookback period for return distribution.
// alpha: Alpha level of VaR cutoff.
public ExpectedShortfallPercent(int period, decimal alpha)
: base("ES", period)
{
_alpha = alpha;
ValueAtRisk = new Identity("ES_VaR");
}
// Override the IsReady method to set up the flag of the Indicator and its IndicatorDataPoint attributes are ready.
public override bool IsReady => ValueAtRisk.IsReady;
// Mandatory: Override the ComputeNextValue method to calculate the indictor value.
protected override decimal ComputeNextValue(IReadOnlyWindow<IndicatorDataPoint> window, IndicatorDataPoint input)
{
if (Samples < 2)
return 0m;
var n = Math.Min(Period, Samples);
var cutoff = (int) Math.Ceiling(n * _alpha);
var samples = new List<decimal>();
for (int i = 0; i < window.Count - 1; i++)
{
samples.Add( (window[i] - window[i+1]) / window[i+1] );
}
var lowest = samples.OrderBy(x => x).Take(cutoff);
ValueAtRisk.Update(input.Time, lowest.Last());
return lowest.Average();
}
}
// Create the expected shortfall indicator to study.
var es = new ExpectedShortfallPercent(50, 0.05m);
// Create a window dictionary to store RollingWindow objects.
var window = new Dictionary<string, RollingWindow<decimal>>();
// Store the RollingWindow objects, index by key is the property of the indicator.
var time = new RollingWindow<DateTime>(20);
window["expectedshortfall"] = new RollingWindow<decimal>(20);
window["valueatrisk"] = new RollingWindow<decimal>(20);
// Define an update function to add the indicator values to the RollingWindow object.
es.Updated += (sender, updated) =>
{
var indicator = (ExpectedShortfallPercent) sender;
time.Add(updated.EndTime);
window["expectedshortfall"].Add(updated);
window["valueatrisk"].Add(indicator.ValueAtRisk.Current);
};
// Iterate through the historical market data and update the indicator.
foreach(var bar in history){
es.Update(bar.EndTime, bar.Close);
}
// Create line chart of the Expected Shortfall Percent.
var chart = Chart2D.Chart.Line<DateTime, decimal, string>(
time,
window["expectedshortfall"]
);
// Create a Layout as the plot settings.
LinearAxis xAxis = new LinearAxis();
xAxis.SetValue("title", "Time");
LinearAxis yAxis = new LinearAxis();
yAxis.SetValue("title", "%");
Title title = Title.init($"Expected Shortfall Percent of {symbol}");
Layout layout = new Layout();
layout.SetValue("xaxis", xAxis);
layout.SetValue("yaxis", yAxis);
layout.SetValue("title", title);
// Assign the Layout to the chart.
chart.WithLayout(layout);
// Display the plot.
display(chart) # Instantiate the QuantBook instance for researching.
qb = QuantBook()
# Request SPY data to work with the indicator.
symbol = qb.add_equity("SPY").symbol
# Request historical trading data with the daily resolution.
history = qb.history[TradeBar](symbol, 70, Resolution.DAILY)
class ExpectedShortfallPercent(PythonIndicator):
    import math, numpy as np

    def __init__(self, period, alpha):
        self.value = None   # Attribute represents the indicator value
        self.value_at_risk = None

        self.alpha = alpha

        self._window = RollingWindow(period)

    # Override the IsReady attribute to flag all attributes values are ready.
    @property
    def is_ready(self) -> bool:
        return self.value and self.value_at_risk

    # Method to update the indicator values. Note that it only receives 1 IBaseData object (Tick, TradeBar, QuoteBar) argument.
    def update(self, input: BaseData) -> bool:
        count = self._window.count

        self._window.add(input.close)

        # Update the Value and other attributes as the indicator current value.
        if count >= 2:
            cutoff = math.ceil(self.alpha * count)

            ret = [ (self._window[i] - self._window[i+1]) / self._window[i+1] for i in range(count-1) ]
            lowest = sorted(ret)[:cutoff]

            self.value = np.mean(lowest)
            self.value_at_risk = lowest[-1]

        # return a boolean to indicate IsReady.
        return count >= 2
# Initialize a new instance of the custom indicator.
custom = ExpectedShortfallPercent(50, 0.05)
# Create a window dictionary to store RollingWindow objects.
window = {}
# Store the RollingWindow objects, index by key is the property of the indicator.
window['time'] = RollingWindow(20)
window['expectedshortfall'] = RollingWindow(20)
window['valueatrisk'] = RollingWindow(20)
# Iterate through the historical market data and update the indicator.
for bar in history:
    custom.update(bar)

    # The Updated event handler is not available for custom indicator in Python, RollingWindows are needed to be updated in here.
    if custom.is_ready:
        window['time'].add(bar.end_time)
        window['expectedshortfall'].add(custom.value)
        window['valueatrisk'].add(custom.value_at_risk)
# Populate a DataFrame with the data in the RollingWindow objects.
custom_dataframe = pd.DataFrame(window).set_index('time')
# Create line chart of the Expected Shortfall Percent.
custom_dataframe.plot(title=f"Expected Shortfall Percent of {symbol}", xlabel="Time", ylabel="%")
plt.show()
You can also see our Videos. You can also get in touch with us via Discord.
Did you find this page helpful?