Datasets
Forex
Create Subscriptions
Follow these steps to subscribe to a Forex security:
- Load the assembly files and data types in their own cell.
- Load the necessary assembly files.
- Import the data types.
- Create a
QuantBook. - (Optional) Set the time zone to the exchange time zone.
- Call the
AddForexadd_forexmethod with a ticker and then save a reference to the ForexSymbol.
#load "../Initialize.csx"
#load "../QuantConnect.csx"
#r "../Microsoft.Data.Analysis.dll"
using QuantConnect;
using QuantConnect.Data;
using QuantConnect.Algorithm;
using QuantConnect.Research;
using QuantConnect.Indicators;
using QuantConnect.Securities.Forex;
using Microsoft.Data.Analysis;
var qb = new QuantBook();
qb = QuantBook()
qb.set_time_zone(TimeZones.UTC);
qb.set_time_zone(TimeZones.UTC)
var eurusd = qb.AddForex("EURUSD").Symbol;
var gbpusd = qb.AddForex("GBPUSD").Symbol;
eurusd = qb.add_forex("EURUSD").symbol
gbpusd = qb.add_forex("GBPUSD").symbol
To view all of the available Forex pairs, see Supported Assets.
Get Historical Data
You need a subscription before you can request historical data for a security. On the time dimension, you can request an amount of historical data based on a trailing number of bars, a trailing period of time, or a defined period of time. On the security dimension, you can request historical data for a single Forex pair, a subset of the pairs you created subscriptions for in your notebook, or all of the pairs in your notebook.
Trailing Number of Bars
To get historical data for a number of trailing bars, call the Historyhistory method with the Symbol object(s) and an integer.
// Slice objects
var singleHistorySlice = qb.History(eurusd, 10);
var subsetHistorySlice = qb.History(new[] {eurusd, gbpusd}, 10);
var allHistorySlice = qb.History(10);

// QuoteBar objects
var singleHistoryQuoteBars = qb.History<QuoteBar>(eurusd, 10);
var subsetHistoryQuoteBars = qb.History<QuoteBar>(new[] {eurusd, gbpusd}, 10);
var allHistoryQuoteBars = qb.History<QuoteBar>(qb.Securities.Keys, 10);
# DataFrame single_history_df = qb.history(eurusd, 10) subset_history_df = qb.history([eurusd, gbpusd], 10) all_history_df = qb.history(qb.securities.keys(), 10) # Slice objects all_history_slice = qb.history(10) # QuoteBar objects single_history_quote_bars = qb.history[QuoteBar](eurusd, 10) subset_history_quote_bars = qb.history[QuoteBar]([eurusd, gbpusd], 10) all_history_quote_bars = qb.history[QuoteBar](qb.securities.keys(), 10)
The preceding calls return the most recent bars, excluding periods of time when the exchange was closed.
Trailing Period of Time
To get historical data for a trailing period of time, call the Historyhistory method with the Symbol object(s) and a TimeSpantimedelta.
// Slice objects
var singleHistorySlice = qb.History(eurusd, TimeSpan.FromDays(3));
var subsetHistorySlice = qb.History(new[] {eurusd, gbpusd}, TimeSpan.FromDays(3));
var allHistorySlice = qb.History(10);

// QuoteBar objects
var singleHistoryQuoteBars = qb.History<QuoteBar>(eurusd, TimeSpan.FromDays(3), Resolution.Minute);
var subsetHistoryQuoteBars = qb.History<QuoteBar>(new[] {eurusd, gbpusd}, TimeSpan.FromDays(3), Resolution.Minute);
var allHistoryQuoteBars = qb.History<QuoteBar>(qb.Securities.Keys, TimeSpan.FromDays(3), Resolution.Minute);

// Tick objects
var singleHistoryTicks = qb.History<Tick>(eurusd, TimeSpan.FromDays(3), Resolution.Tick);
var subsetHistoryTicks = qb.History<Tick>(new[] {eurusd, gbpusd}, TimeSpan.FromDays(3), Resolution.Tick);
var allHistoryTicks = qb.History<Tick>(qb.Securities.Keys, TimeSpan.FromDays(3), Resolution.Tick);
# DataFrame of quote data (Forex data doesn't have trade data)
single_history_df = qb.history(eurusd, timedelta(days=3))
subset_history_df = qb.history([eurusd, gbpusd], timedelta(days=3))
all_history_df = qb.history(qb.securities.keys(), timedelta(days=3))

# DataFrame of tick data
single_history_tick_df = qb.history(eurusd, timedelta(days=3), Resolution.TICK)
subset_history_tick_df = qb.history([eurusd, gbpusd], timedelta(days=3), Resolution.TICK)
all_history_tick_df = qb.history(qb.securities.keys(), timedelta(days=3), Resolution.TICK)

# Slice objects
all_history_slice = qb.history(timedelta(days=3))

# QuoteBar objects
single_history_quote_bars = qb.history[QuoteBar](eurusd, timedelta(days=3), Resolution.MINUTE)
subset_history_quote_bars = qb.history[QuoteBar]([eurusd, gbpusd], timedelta(days=3), Resolution.MINUTE)
all_history_quote_bars = qb.history[QuoteBar](qb.securities.keys(), timedelta(days=3), Resolution.MINUTE)

# Tick objects
single_history_ticks = qb.history[Tick](eurusd, timedelta(days=3), Resolution.TICK)
subset_history_ticks = qb.history[Tick]([eurusd, gbpusd], timedelta(days=3), Resolution.TICK)
all_history_ticks = qb.history[Tick](qb.securities.keys(), timedelta(days=3), Resolution.TICK)
The preceding calls return the most recent bars or ticks, excluding periods of time when the exchange was closed.
Defined Period of Time
To get historical data for a specific period of time, call the Historyhistory method with the Symbol object(s), a start DateTimedatetime, and an end DateTimedatetime. The start and end times you provide are based in the notebook time zone.
var startTime = new DateTime(2021, 1, 1);
var endTime = new DateTime(2021, 2, 1);

// Slice objects
var singleHistorySlice = qb.History(eurusd, startTime, endTime);
var subsetHistorySlice = qb.History(new[] {eurusd, gbpusd}, startTime, endTime);
var allHistorySlice = qb.History(qb.Securities.Keys, startTime, endTime);

// QuoteBar objects
var singleHistoryQuoteBars = qb.History<QuoteBar>(eurusd, startTime, endTime, Resolution.Minute);
var subsetHistoryQuoteBars = qb.History<QuoteBar>(new[] {eurusd, gbpusd}, startTime, endTime, Resolution.Minute);
var allHistoryQuoteBars = qb.History<QuoteBar>(qb.Securities.Keys, startTime, endTime, Resolution.Minute);

// Tick objects
var singleHistoryTicks = qb.History<Tick>(eurusd, startTime, endTime, Resolution.Tick);
var subsetHistoryTicks = qb.History<Tick>(new[] {eurusd, gbpusd}, startTime, endTime, Resolution.Tick);
var allHistoryTicks = qb.History<Tick>(qb.Securities.Keys, startTime, endTime, Resolution.Tick);
start_time = datetime(2021, 1, 1) end_time = datetime(2021, 2, 1) # DataFrame of quote data (Forex data doesn't have trade data) single_history_df = qb.history(eurusd, start_time, end_time) subset_history_df = qb.history([eurusd, gbpusd], start_time, end_time) all_history_df = qb.history(qb.securities.keys(), start_time, end_time) # DataFrame of tick data single_history_tick_df = qb.history(eurusd, start_time, end_time, Resolution.TICK) subset_history_tick_df = qb.history([eurusd, gbpusd], start_time, end_time, Resolution.TICK) all_history_tick_df = qb.history(qb.securities.keys(), start_time, end_time, Resolution.TICK) # QuoteBar objects single_history_quote_bars = qb.history[QuoteBar](eurusd, start_time, end_time, Resolution.MINUTE) subset_history_quote_bars = qb.history[QuoteBar]([eurusd, gbpusd], start_time, end_time, Resolution.MINUTE) all_history_quote_bars = qb.history[QuoteBar](qb.securities.keys(), start_time, end_time, Resolution.MINUTE) # Tick objects single_history_ticks = qb.history[Tick](eurusd, start_time, end_time, Resolution.TICK) subset_history_ticks = qb.history[Tick]([eurusd, gbpusd], start_time, end_time, Resolution.TICK) all_history_ticks = qb.history[Tick](qb.securities.keys(), start_time, end_time, Resolution.TICK)
The preceding calls return the bars or ticks that have a timestamp within the defined period of time.
Resolutions
The following table shows the available resolutions and data formats for Forex subscriptions:
| Resolution | TradeBar | QuoteBar | Trade Tick | Quote Tick |
|---|---|---|---|---|
TickTICK | Not supported | Not supported | Not supported | Supported✓ |
SecondSECOND | Supported✓ | Not supported | Not supported | |
MinuteMINUTE | Supported✓ | Not supported | Not supported | |
HourHOUR | Supported✓ | Not supported | Not supported | |
DailyDAILY | Supported✓ | Not supported | Not supported |
Wrangle Data
You need some historical data to perform wrangling operations. The process to manipulate the historical data depends on its data type. To display pandas objects, run a cell in a notebook with the pandas object as the last line. To display other data formats, call the print method.
You need some historical data to perform wrangling operations. Use LINQ to wrangle the data and then call the Console.WriteLine method in a Jupyter Notebook to display the data. The process to manipulate the historical data depends on its data type.
DataFrame Objects
If the Historyhistory method returns a DataFrame, the first level of the DataFrame index is the encoded Forex Symbol and the second level is the EndTimeend_time of the data sample. The columns of the DataFrame are the data properties.
| askclose | askhigh | asklow | askopen | bidclose | bidhigh | bidlow | bidopen | close | high | low | open | ||
|---|---|---|---|---|---|---|---|---|---|---|---|---|---|
| symbol | time | ||||||||||||
| EURUSD 8G | 2021-01-03 17:01:00 | 1.22423 | 1.22430 | 1.22414 | 1.22415 | 1.22388 | 1.22388 | 1.22372 | 1.22384 | 1.224055 | 1.224090 | 1.223930 | 1.223995 |
| 2021-01-03 17:02:00 | 1.22452 | 1.22460 | 1.22414 | 1.22423 | 1.22389 | 1.22394 | 1.22377 | 1.22388 | 1.224205 | 1.224270 | 1.223955 | 1.224055 | |
| 2021-01-03 17:03:00 | 1.22435 | 1.22453 | 1.22435 | 1.22452 | 1.22366 | 1.22389 | 1.22366 | 1.22389 | 1.224005 | 1.224210 | 1.224005 | 1.224205 | |
| 2021-01-03 17:04:00 | 1.22425 | 1.22435 | 1.22425 | 1.22435 | 1.22351 | 1.22366 | 1.22351 | 1.22366 | 1.223880 | 1.224005 | 1.223880 | 1.224005 | |
| 2021-01-03 17:05:00 | 1.22413 | 1.22425 | 1.22398 | 1.22425 | 1.22313 | 1.22366 | 1.22298 | 1.22351 | 1.223630 | 1.223955 | 1.223480 | 1.223880 | |
| ... | ... | ... | ... | ... | ... | ... | ... | ... | ... | ... | ... | ... | ... |
| GBPUSD 8G | 2021-01-31 23:56:00 | 1.37335 | 1.37342 | 1.37335 | 1.37335 | 1.37314 | 1.37323 | 1.37314 | 1.37316 | 1.373245 | 1.373325 | 1.373245 | 1.373255 |
| 2021-01-31 23:57:00 | 1.37327 | 1.37335 | 1.37327 | 1.37335 | 1.37306 | 1.37314 | 1.37306 | 1.37314 | 1.373165 | 1.373245 | 1.373165 | 1.373245 | |
| 2021-01-31 23:58:00 | 1.37338 | 1.37341 | 1.37333 | 1.37327 | 1.37319 | 1.37319 | 1.37306 | 1.37306 | 1.373285 | 1.373285 | 1.373160 | 1.373165 | |
| 2021-01-31 23:59:00 | 1.37333 | 1.37341 | 1.37333 | 1.37338 | 1.37317 | 1.37321 | 1.37316 | 1.37319 | 1.373250 | 1.373310 | 1.373245 | 1.373285 | |
| 2021-02-01 00:00:00 | 1.37334 | 1.37337 | 1.37332 | 1.37333 | 1.37316 | 1.37319 | 1.37313 | 1.37317 | 1.373250 | 1.373280 | 1.373225 | 1.373250 |
To select the historical data of a single Forex, index the loc property of the DataFrame with the Forex Symbol.
all_history_df.loc[eurusd] # or all_history_df.loc['EURUSD']
| askclose | askhigh | asklow | askopen | bidclose | bidhigh | bidlow | bidopen | close | high | low | open | |
|---|---|---|---|---|---|---|---|---|---|---|---|---|
| time | ||||||||||||
| 2021-01-03 17:01:00 | 1.22423 | 1.22430 | 1.22414 | 1.22415 | 1.22388 | 1.22388 | 1.22372 | 1.22384 | 1.224055 | 1.224090 | 1.223930 | 1.223995 |
| 2021-01-03 17:02:00 | 1.22452 | 1.22460 | 1.22414 | 1.22423 | 1.22389 | 1.22394 | 1.22377 | 1.22388 | 1.224205 | 1.224270 | 1.223955 | 1.224055 |
| 2021-01-03 17:03:00 | 1.22435 | 1.22453 | 1.22435 | 1.22452 | 1.22366 | 1.22389 | 1.22366 | 1.22389 | 1.224005 | 1.224210 | 1.224005 | 1.224205 |
| 2021-01-03 17:04:00 | 1.22425 | 1.22435 | 1.22425 | 1.22435 | 1.22351 | 1.22366 | 1.22351 | 1.22366 | 1.223880 | 1.224005 | 1.223880 | 1.224005 |
| 2021-01-03 17:05:00 | 1.22413 | 1.22425 | 1.22398 | 1.22425 | 1.22313 | 1.22366 | 1.22298 | 1.22351 | 1.223630 | 1.223955 | 1.223480 | 1.223880 |
| ... | ... | ... | ... | ... | ... | ... | ... | ... | ... | ... | ... | ... |
| 2021-01-31 23:56:00 | 1.20928 | 1.20935 | 1.20921 | 1.20925 | 1.20857 | 1.20864 | 1.20850 | 1.20854 | 1.208925 | 1.208995 | 1.208855 | 1.208895 |
| 2021-01-31 23:57:00 | 1.20930 | 1.20936 | 1.20924 | 1.20928 | 1.20856 | 1.20862 | 1.20852 | 1.20857 | 1.208930 | 1.208990 | 1.208880 | 1.208925 |
| 2021-01-31 23:58:00 | 1.20924 | 1.20932 | 1.20920 | 1.20930 | 1.20857 | 1.20860 | 1.20849 | 1.20856 | 1.208905 | 1.208960 | 1.208845 | 1.208930 |
| 2021-01-31 23:59:00 | 1.20927 | 1.20930 | 1.20922 | 1.20924 | 1.20856 | 1.20860 | 1.20853 | 1.20857 | 1.208915 | 1.208950 | 1.208875 | 1.208905 |
| 2021-02-01 00:00:00 | 1.20926 | 1.20929 | 1.20923 | 1.20927 | 1.20858 | 1.20860 | 1.20855 | 1.20856 | 1.208920 | 1.208945 | 1.208890 | 1.208915 |
To select a column of the DataFrame, index it with the column name.
all_history_df.loc[eurusd]['close']
time
2021-01-03 17:01:00    1.224055
2021-01-03 17:02:00    1.224205
2021-01-03 17:03:00    1.224005
2021-01-03 17:04:00    1.223880
2021-01-03 17:05:00    1.223630
                          ...
2021-01-31 23:56:00    1.208925
2021-01-31 23:57:00    1.208930
2021-01-31 23:58:00    1.208905
2021-01-31 23:59:00    1.208915
2021-02-01 00:00:00    1.208920
Name: close, dtype: float64
If you request historical data for multiple Forex pairs, you can transform the DataFrame so that it's a time series of close values for all of the Forex pairs. To transform the DataFrame, select the column you want to display for each Forex pair and then call the unstack method.
all_history_df['close'].unstack(level=0)
The DataFrame is transformed so that the column indices are the Symbol of each Forex pair and each row contains the close value.
| symbol | EURUSD 8G | GBPUSD 8G |
|---|---|---|
| time | ||
| 2021-01-03 17:01:00 | 1.224055 | NaN |
| 2021-01-03 17:02:00 | 1.224205 | NaN |
| 2021-01-03 17:03:00 | 1.224005 | NaN |
| 2021-01-03 17:04:00 | 1.223880 | NaN |
| 2021-01-03 17:05:00 | 1.223630 | NaN |
| ... | ... | ... |
| 2021-01-31 23:56:00 | 1.208925 | 1.373245 |
| 2021-01-31 23:57:00 | 1.208930 | 1.373165 |
| 2021-01-31 23:58:00 | 1.208905 | 1.373285 |
| 2021-01-31 23:59:00 | 1.208915 | 1.373250 |
| 2021-02-01 00:00:00 | 1.208920 | 1.373250 |
The historical data methods don't return DataFrame objects, but you can create one for efficient vectorized data wrangling.
using Microsoft.Data.Analysis;

var columns = new DataFrameColumn[] {
    new PrimitiveDataFrameColumn("Time", history.Select(x => x[eurusd].EndTime)),
    new DecimalDataFrameColumn("EURUSD Open", history.Select(x => x[eurusd].Open)),
    new DecimalDataFrameColumn("EURUSD High", history.Select(x => x[eurusd].High)),
    new DecimalDataFrameColumn("EURUSD Low", history.Select(x => x[eurusd].Low)),
    new DecimalDataFrameColumn("EURUSD Close", history.Select(x => x[eurusd].Close))
};
var df = new DataFrame(columns);
df
| Time | EURUSD Open | EURUSD High | EURUSD Low | EURUSD Close |
|---|---|---|---|---|
| 2/10/2023 12:01:00 AM | 1.07186 | 1.072115 | 1.071815 | 1.072075 |
| 2/10/2023 12:02:00 AM | 1.072075 | 1.07216 | 1.07202 | 1.072135 |
| 2/10/2023 12:03:00 AM | 1.072135 | 1.07217 | 1.07207 | 1.072155 |
| 2/10/2023 12:04:00 AM | 1.072155 | 1.07217 | 1.072075 | 1.072085 |
| 2/10/2023 12:05:00 AM | 1.072085 | 1.072195 | 1.072035 | 1.072195 |
| 2/10/2023 12:06:00 AM | 1.072195 | 1.07227 | 1.072175 | 1.072225 |
| 2/10/2023 12:07:00 AM | 1.072225 | 1.07234 | 1.072205 | 1.07233 |
| 2/10/2023 12:08:00 AM | 1.07233 | 1.072335 | 1.072225 | 1.072265 |
| 2/10/2023 12:09:00 AM | 1.072265 | 1.07227 | 1.07220 | 1.072205 |
| 2/10/2023 12:10:00 AM | 1.072205 | 1.07226 | 1.07216 | 1.072225 |
| 2/10/2023 12:11:00 AM | 1.072225 | 1.072245 | 1.07218 | 1.07218 |
| 2/10/2023 12:12:00 AM | 1.07218 | 1.07223 | 1.072165 | 1.072225 |
| 2/10/2023 12:13:00 AM | 1.072225 | 1.07223 | 1.072165 | 1.072165 |
| 2/10/2023 12:14:00 AM | 1.072165 | 1.072245 | 1.072155 | 1.072225 |
| 2/10/2023 12:15:00 AM | 1.072225 | 1.07223 | 1.072165 | 1.07217 |
| 2/10/2023 12:16:00 AM | 1.07217 | 1.07217 | 1.07209 | 1.072125 |
| 2/10/2023 12:17:00 AM | 1.072125 | 1.072165 | 1.072105 | 1.07216 |
| 2/10/2023 12:18:00 AM | 1.07216 | 1.072175 | 1.07212 | 1.07215 |
| 2/10/2023 12:19:00 AM | 1.07215 | 1.072155 | 1.07210 | 1.07211 |
| 2/10/2023 12:20:00 AM | 1.07211 | 1.07212 | 1.071925 | 1.072035 |
| 2/10/2023 12:21:00 AM | 1.072035 | 1.072365 | 1.07203 | 1.07211 |
| 2/10/2023 12:22:00 AM | 1.07211 | 1.07214 | 1.072005 | 1.072025 |
| 2/10/2023 12:23:00 AM | 1.072025 | 1.07218 | 1.07200 | 1.072075 |
| 2/10/2023 12:24:00 AM | 1.072075 | 1.07211 | 1.07200 | 1.07201 |
| ... | ... | ... | ... | ... |
| 2/19/2023 11:57:00 PM | 1.06873 | 1.06873 | 1.068655 | 1.068675 |
| 2/19/2023 11:58:00 PM | 1.068675 | 1.06873 | 1.068645 | 1.068715 |
| 2/19/2023 11:59:00 PM | 1.068715 | 1.06873 | 1.068705 | 1.068715 |
| 2/20/2023 12:00:00 AM | 1.068715 | 1.06873 | 1.06863 | 1.06868 |
To select a particular column of the DataFrame, index it with the column name.
df["EURUSD close"]
| index | value |
|---|---|
| 0 | 1.072075 |
| 1 | 1.072135 |
| 2 | 1.072155 |
| 3 | 1.072085 |
| 4 | 1.072195 |
| 5 | 1.072225 |
| 6 | 1.07233 |
| 7 | 1.072265 |
| 8 | 1.072205 |
| 9 | 1.072225 |
| 10 | 1.07218 |
| 11 | 1.072225 |
| 12 | 1.072165 |
| 13 | 1.072225 |
| 14 | 1.07217 |
| 15 | 1.072125 |
| 16 | 1.07216 |
| 17 | 1.07215 |
| 18 | 1.07211 |
| 19 | 1.072035 |
| ... (more) | |
Slice Objects
If the Historyhistory method returns Slice objects, iterate through the Slice objects to get each one. The Slice objects may not have data for all of your Forex subscriptions. To avoid issues, check if the Slice contains data for your Forex pair before you index it with the Forex Symbol.
foreach (var slice in allHistorySlice) {
    if (slice.QuoteBars.ContainsKey(eurusd))
    {
        var quoteBar = slice.QuoteBars[eurusd];
    }
}
for slice in all_history_slice:
if slice.quote_bars.contains_key(eurusd):
quote_bar = slice.quote_bars[eurusd]
You can also iterate through each QuoteBar in the Slice.
foreach (var slice in allHistorySlice)
{
    foreach (var kvp in slice.QuoteBars)
    {
        var symbol = kvp.Key;
        var quoteBar = kvp.Value;
    }
}
for slice in all_history_slice:
for kvp in slice.quote_bars:
symbol = kvp.key
quote_bar = kvp.value
You can also use LINQ to select each QuoteBar in the Slice for a given Symbol.
var quoteBars = allHistorySlice.Where(slice => slice.QuoteBars.ContainsKey(eurusd)).Select(slice => slice.QuoteBars[eurusd]);
QuoteBar Objects
If the Historyhistory method returns QuoteBar objects, iterate through the QuoteBar objects to get each one.
foreach (var quoteBar in singleHistoryQuoteBars)
{
    Console.WriteLine(quoteBar);
}
for quote_bar in single_history_quote_bars:
print(quote_bar)
If the Historyhistory method returns QuoteBars, iterate through the QuoteBars to get the QuoteBar of each Forex pair. The QuoteBars may not have data for all of your Forex subscriptions. To avoid issues, check if the QuoteBars object contains data for your security before you index it with the Forex Symbol.
foreach (var quoteBars in allHistoryQuoteBars)
{
    if (quoteBars.ContainsKey(eurusd))
    {
        var quoteBar = quoteBars[eurusd];
    }
}
for quote_bars in all_history_quote_bars:
if quote_bars.contains_key(eurusd):
quote_bar = quote_bars[eurusd]
You can also iterate through each of the QuoteBars.
foreach (var quoteBars in allHistoryQuoteBars)
{
    foreach (var kvp in quoteBars)
    {
        var symbol = kvp.Key;
        var quoteBar = kvp.Value;
    }
}
for quote_bars in all_history_quote_bars:
for kvp in quote_bars:
symbol = kvp.key
quote_bar = kvp.value
Tick Objects
If the Historyhistory method returns TickTICK objects, iterate through the TickTICK objects to get each one.
foreach (var tick in singleHistoryTicks)
{
    Console.WriteLine(tick);
}
for tick in single_history_ticks:
print(tick)
If the Historyhistory method returns Ticks, iterate through the Ticks to get the TickTICK of each Forex pair. The Ticks may not have data for all of your Forex subscriptions. To avoid issues, check if the Ticks object contains data for your security before you index it with the Forex Symbol.
foreach (var ticks in allHistoryTicks)
{
    if (ticks.ContainsKey(eurusd))
    {
        var tick = ticks[eurusd];
    }
}
for ticks in all_history_ticks:
if ticks.contains_key(eurusd):
ticks = ticks[eurusd]
You can also iterate through each of the Ticks.
foreach (var ticks in allHistoryTicks)
{
    foreach (var kvp in ticks)
    {
        var symbol = kvp.Key;
        var tick = kvp.Value;
    }
}
for ticks in all_history_ticks:
for kvp in ticks:
symbol = kvp.key
tick = kvp.value
The Ticks objects only contain the last tick of each security for that particular timeslice
Plot Data
You need some historical Forex data to produce plots. You can use many of the supported plotting librariesPlot.NET package to visualize data in various formats. For example, you can plot candlestick and line charts.
Candlestick Chart
Follow these steps to plot candlestick charts:
- Get some historical data.
- Import the
plotlyPlot.NETlibrary. - Create a
Candlestick. - Create a
Layout. - Create the
Figure. - Assign the
Layoutto the chart. - Show the
Figure.
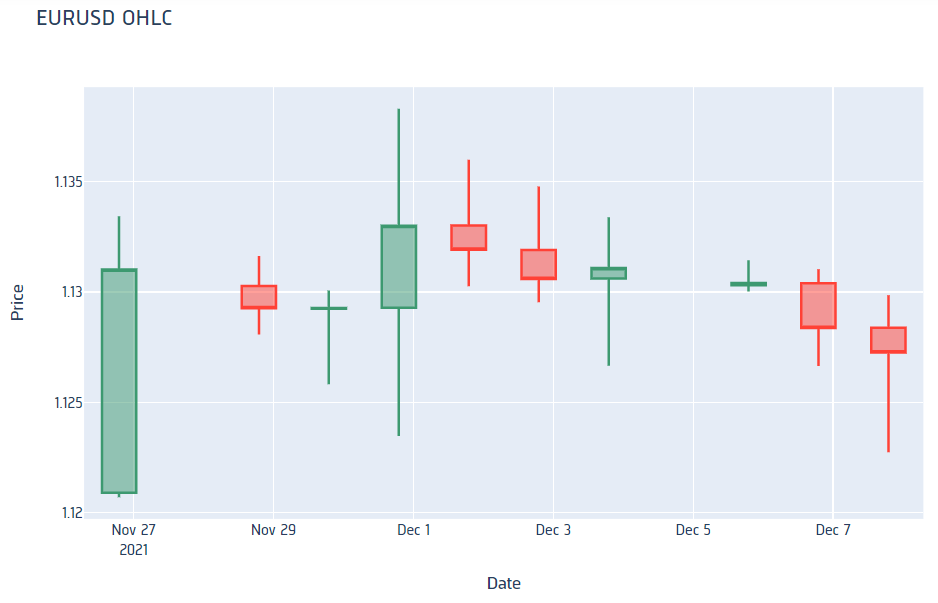
history = qb.history(eurusd, datetime(2021, 11, 26), datetime(2021, 12, 8), Resolution.DAILY).loc[eurusd]
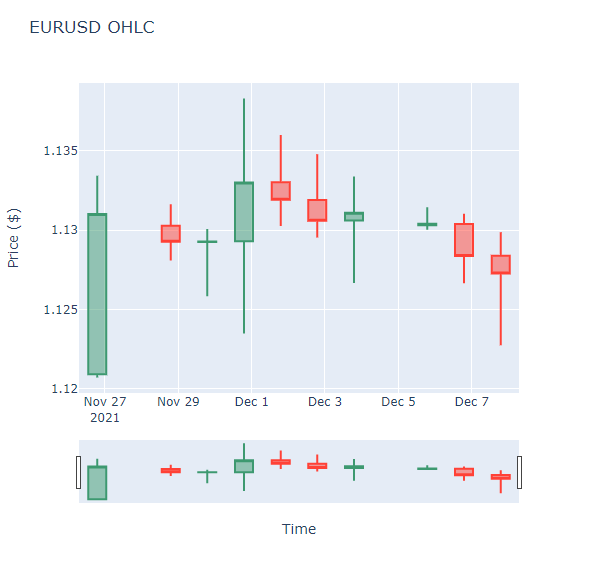
var history = qb.History<QuoteBar>(eurusd, new DateTime(2021, 11, 26), new DateTime(2021, 12, 8), Resolution.Daily);
import plotly.graph_objects as go
#r "nuget: Plotly.NET"
#r "nuget: Plotly.NET.Interactive"
using Plotly.NET;
using Plotly.NET.Interactive;
using Plotly.NET.LayoutObjects;
candlestick = go.Candlestick(x=history.index,
                             open=history['open'],
                             high=history['high'],
                             low=history['low'],
                             close=history['close'])
var chart = Chart2D.Chart.Candlestick<decimal, decimal, decimal, decimal, DateTime, string>(
history.Select(x => x.Open),
history.Select(x => x.High),
history.Select(x => x.Low),
history.Select(x => x.Close),
history.Select(x => x.EndTime)
);
layout = go.Layout(title=go.layout.Title(text='EURUSD OHLC'),
                   xaxis_title='Date',
                   yaxis_title='Price',
                   xaxis_rangeslider_visible=False)
LinearAxis xAxis = new LinearAxis();
xAxis.SetValue("title", "Time");
LinearAxis yAxis = new LinearAxis();
yAxis.SetValue("title", "Price ($)");
Title title = Title.init($"{eurusd} OHLC");
Layout layout = new Layout();
layout.SetValue("xaxis", xAxis);
layout.SetValue("yaxis", yAxis);
layout.SetValue("title", title);
fig = go.Figure(data=[candlestick], layout=layout)
chart.WithLayout(layout);
fig.show()
display(chart)
Candlestick charts display the open, high, low, and close prices of the security.
Line Chart
Follow these steps to plot line charts using built-in methodsPlotly.NET package:
- Get some historical data.
- Select the data to plot.
- Call the
plotmethod on thepandasobject. - Create
Linecharts. - Create a
Layout. - Combine the charts and assign the
Layoutto the chart. - Show the plot.
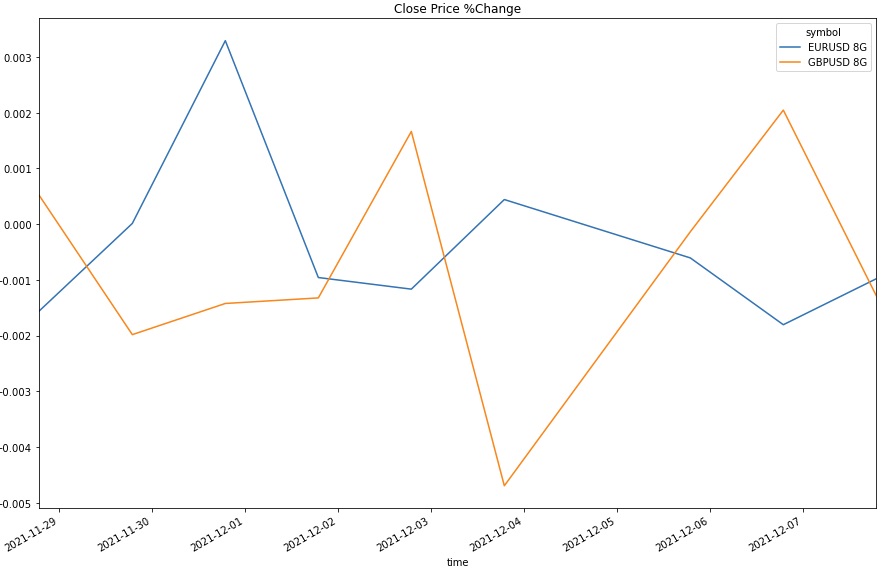
history = qb.history([eurusd, gbpusd], datetime(2021, 11, 26), datetime(2021, 12, 8), Resolution.DAILY)
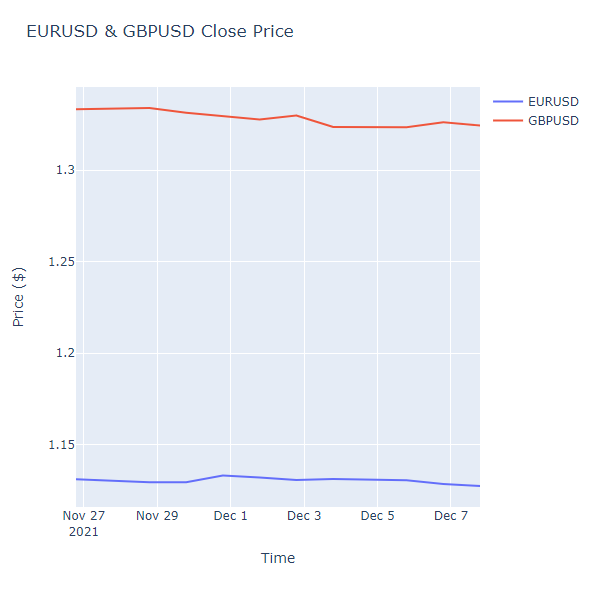
var history = qb.History<QuoteBar>(new [] {eurusd, gbpusd}, new DateTime(2021, 11, 26), new DateTime(2021, 12, 8), Resolution.Daily);
pct_change = history['close'].unstack(0).pct_change().dropna()
pct_change.plot(title="Close Price %Change", figsize=(15, 10))
var chart1 = Chart2D.Chart.Line<DateTime, decimal, string>(
    history.Select(x => x[eurusd].EndTime),
    history.Select(x => x[eurusd].Close),
    Name: "EURUSD"
);
var chart2 = Chart2D.Chart.Line<DateTime, decimal, string>(
    history.Select(x => x[gbpusd].EndTime),
    history.Select(x => x[gbpusd].Close),
    Name: "GBPUSD"
);
LinearAxis xAxis = new LinearAxis();
xAxis.SetValue("title", "Time");
LinearAxis yAxis = new LinearAxis();
yAxis.SetValue("title", "Price ($)");
Title title = Title.init("EURUSD & GBPUSD Close Price");

Layout layout = new Layout();
layout.SetValue("xaxis", xAxis);
layout.SetValue("yaxis", yAxis);
layout.SetValue("title", title);
var chart = Plotly.NET.Chart.Combine(new []{chart1, chart2});
chart.WithLayout(layout);
plt.show()
display(chart)
Line charts display the value of the property you selected in a time series.
Examples
The following examples demonstrate some common practices for applying the Forex dataset.
Example 1: 5-Minute Candlestick Plot
The following example studies the candlestick pattern of the USDJPY. To study the short term pattern, we consolidate the data into 5 minute bars and plot the 5-minute candlestick plot, using the mid prices.
// Load the required assembly files and data types in a separate cell.
#load "../Initialize.csx"
// Load the necessary assembly files.
#load "../QuantConnect.csx"
#r "nuget: Plotly.NET"
#r "nuget: Plotly.NET.Interactive"
using System;
using QuantConnect;
using QuantConnect.Data;
using QuantConnect.Data.Market;
using QuantConnect.Data.Consolidators;
using QuantConnect.Indicators;
using QuantConnect.Algorithm;
using QuantConnect.Research;
using QuantConnect.Securities;

using Plotly.NET;
using Plotly.NET.Interactive;
using Plotly.NET.LayoutObjects;

// Create a QuantBook.
var qb = new QuantBook();

// Request the USDJPY historical data.
var symbol = qb.AddForex("USDJPY").Symbol;
var history = qb.History<QuoteBar>(symbol,
    start: qb.Time - TimeSpan.FromDays(182),
    end: qb.Time,
    resolution: Resolution.Minute);

// Set up a consolidator and a RollingWindow to save the data
var consolidator = new QuoteBarConsolidator(TimeSpan.FromMinutes(5));
var window = new RollingWindow<QuoteBar>(10000);

// Attach a consolidation handler method that saves the consolidated bars in the RollingWindow
consolidator.DataConsolidated += (sender, consolidated) =>
{
    window.Add(consolidated);
};

// Iterate the historical market data and feed each bar into the consolidator
foreach(var bar in history)
{
    consolidator.Update(bar);
}

// Crete the Candlestick chart using the 5-minute windows with mid prices.
var chart = Chart2D.Chart.Candlestick<decimal, decimal, decimal, decimal, DateTime, string>(
    window.Select(x => (x.Ask.Open + x.Bid.Open) * 0.5m),
    window.Select(x => (x.Ask.High + x.Bid.High) * 0.5m),
    window.Select(x => (x.Ask.Low + x.Bid.Low) * 0.5m),
    window.Select(x => (x.Ask.Close + x.Bid.Close) * 0.5m),
    window.Select(x => x.EndTime)
);
// Create a Layout as the plot settings.
LinearAxis xAxis = new LinearAxis();
xAxis.SetValue("title", "Time");
LinearAxis yAxis = new LinearAxis();
yAxis.SetValue("title", "Price ($)");
Title title = Title.init($"{symbol} Price");

Layout layout = new Layout();
layout.SetValue("xaxis", xAxis);
layout.SetValue("yaxis", yAxis);
layout.SetValue("title", title);
// Assign the Layout to the chart.
chart.WithLayout(layout);
// Display the plot.
display(chart)
# Import plotly library for plotting.
import plotly.graph_objects as go
# Create a QuantBook
qb = QuantBook()
# Request USDJPY's historical data.
symbol = qb.add_forex("USDJPY").symbol
history = qb.history(symbol,
start=qb.time - timedelta(days=182),
end=qb.time,
resolution=Resolution.MINUTE)
# Drop level 0 index (Symbol index) from the DataFrame
history = history.droplevel([0])
# Select the required columns to obtain the 5-minute OHLC data.
history = history[["open", "high", "low", "close"]].resample("5T").agg({
"open": "first",
"high": "max",
"low": "min",
"close": "last"
})
# Crete the Candlestick chart using the 5-minute windows.
candlestick = go.Candlestick(x=history.index,
open=history['open'],
high=history['high'],
low=history['low'],
close=history['close'])
# Create a Layout as the plot settings.
layout = go.Layout(title=go.layout.Title(text=f'{symbol} OHLC'),
xaxis_title='Date',
yaxis_title='Price',
xaxis_rangeslider_visible=False)
# Create the Figure.
fig = go.Figure(data=[candlestick], layout=layout)
# Display the plot.
fig.show()
You can also see our Videos. You can also get in touch with us via Discord.
Did you find this page helpful?