Key Concepts
Getting Started

Introduction
The Research Environment is a Jupyter notebook-based, interactive commandline environment where you can access our data through the QuantBook class. The environment supports both Python and C#. If you use Python, you can import code from the code files in your project into the Research Environment to aid development.
Before you run backtests, we recommend testing your hypothesis in the Research Environment. It's easier to perform data analysis and produce plots in the Research Environment than in a backtest.
Before backtesting or live trading with machine learning models, you may find it beneficial to train them in the Research Environment, save them in the Object Store, and then load them from the Object Store into the backtesting and live trading environment
In the Research Environment, you can also use the QuantConnect API to import your backtest results for further analysis.
Example
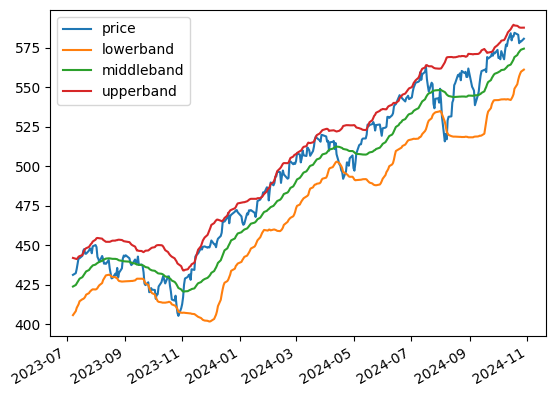
The following snippet demonstrates how to use the Research Environment to plot the price and Bollinger Bands of the S&P 500 index ETF, SPY:
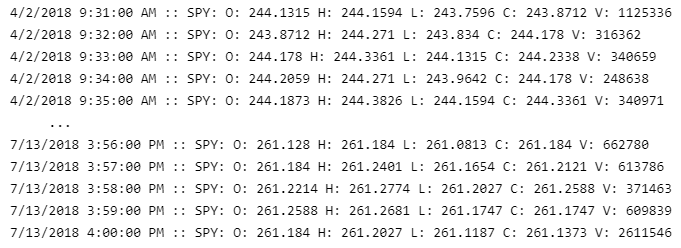
The following snippet demonstrates how to use the Research Environment to print the price of the S&P 500 index ETF, SPY:
// Load the required assembly files and data types in a separate cell.
#load "../Initialize.csx"
# Create a QuantBook
qb = QuantBook()

# Add an asset.
symbol = qb.add_equity("SPY").symbol

# Request some historical data.
history = qb.history(symbol, 360, Resolution.DAILY)

# Calculate the Bollinger Bands.
bbdf = qb.indicator_history(BollingerBands(30, 2), symbol, 360, Resolution.DAILY).data_frame

# Plot the data
bbdf[['price', 'lowerband', 'middleband', 'upperband']].plot();
#load "../QuantConnect.csx"
using QuantConnect;
using QuantConnect.Data;
using QuantConnect.Algorithm;
using QuantConnect.Research;

// Create a QuantBook
var qb = new QuantBook();

// Create a security subscription
var symbol = qb.AddEquity("SPY").Symbol;

// Request some historical data
var history = qb.History(symbol, 70, Resolution.Daily);

foreach (var tradeBar in history)
{
    Console.WriteLine($"{tradeBar.EndTime} :: {tradeBar.ToString()}");
}
Open Notebooks
The process to open notebooks depends on if you use the Algorithm Lab, Local Platform, or the CLI.
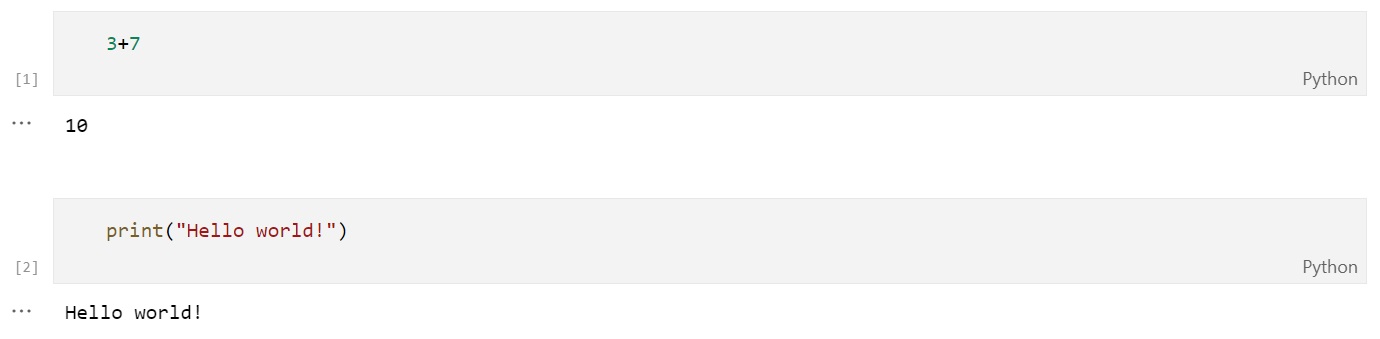
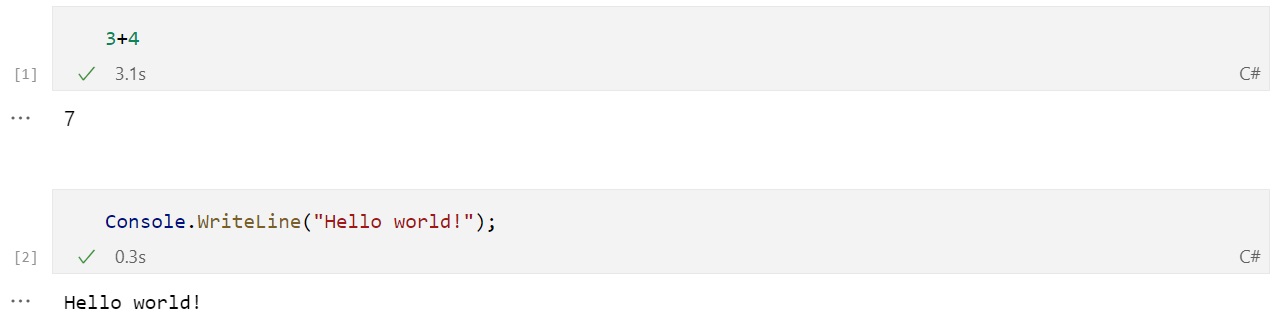
Run Notebook Cells
Notebooks are a collection of cells where you can write code snippets or MarkDown. To execute a cell, press Shift+Enter.
The following describes some helpful keyboard shortcuts to speed up your research:
| Keyboard Shortcut | Description |
|---|---|
| Shift+Enter | Run the selected cell. |
| a | Insert a cell above the selected cell. |
| b | Insert a cell below the selected cell. |
| x | Cut the selected cell. |
| v | Paste the copied or cut cell. |
| z | Undo cell actions. |
Stop Nodes
The process to stop Research Environment nodes depends on if you use the Algorithm Lab, Local Platform, or the CLI.
Add Notebooks
The process to add notebook files depends on if you use the Algorithm Lab, Local Platform, or the CLI.
Rename Notebooks
The process to rename notebook files depends on if you use the Algorithm Lab, Local Platform, or the CLI.
Delete Notebooks
The process to delete notebooks depends on if you use the Algorithm Lab, Local Platform, or the CLI.
Learn Jupyter
The following table lists some helpful resources to learn Jupyter:
| Type | Name | Producer |
|---|---|---|
| Text | Jupyter Tutorial | tutorialspoint |
| Text | Jupyter Notebook Tutorial: The Definitive Guide | DataCamp |
| Text | An Introduction to DataFrame | Microsoft Developer Blogs |
You can also see our Videos. You can also get in touch with us via Discord.
Did you find this page helpful?