Writing Algorithms
Charting
Charts
Charts contain a collection of series, which display data on the chart. To add a chart to an algorithm, create a Chart object and then call the AddChartadd_chart method.
var chart = new Chart("<chartName>");
AddChart(chart);
chart = Chart("<chartName>")
self.add_chart(chart)
The Chart constructor expects a name argument. The following chart names are reserved:
- Assets Sales Volume
- Exposure
- Portfolio Margin
Series
A chart series displays data on the chart. To add a series to a chart, create a Series object and then call the AddSeriesadd_series method.
var series = new Series("<seriesName>");
chart.AddSeries(series);
series = Series("<seriesName>")
chart.add_series(series)
Arguments
There are several other headers for the Series constructor.
Series(name, type)
Series(name, type, index)
Series(name, type, index, unit)
Series(name, type, unit)
Series(name, type, unit, color)
Series(name, type, unit, color, symbol)
The following table describes the constructor arguments:
| Argument | Data Type | Description |
|---|---|---|
name | stringstr | Name of the series |
type | SeriesType | Type of the series |
index | int | Index position on the chart of the series |
unit | stringstr | Unit for the series axis |
color | Color | Color of the series |
symbol | ScatterMarkerSymbol | Symbol for the marker in a scatter plot series |
The default Series is a line chart with a "$" unit on index 0.
Names
The Series constructor expects a name argument. If you add a series to one of the default charts, some series names may be reserved. The following table shows the reserved series name for the default charts:
| Chart Name | Reserved Series Names |
|---|---|
| Strategy Equity | Equity, Return |
| Capacity | Strategy Capacity |
| Drawdown | Equity Drawdown |
| Benchmark | Benchmark |
| Portfolio Turnover | Portfolio Turnover |
Types
The SeriesType enumeration has the following members:
Index
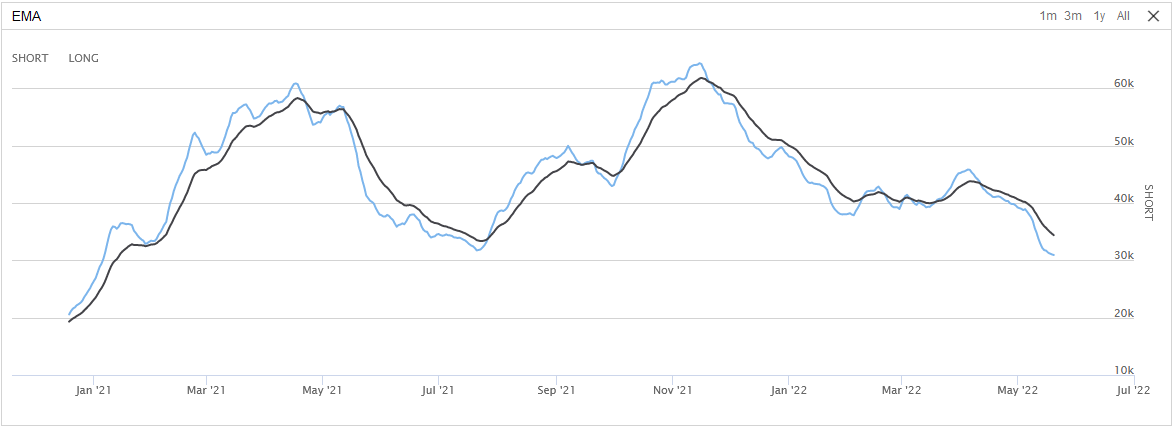
The series index refers to its position in the chart. If all the series are at index 0, they lay on top of each other. If each series has its own index, each series will be separate on the chart. The following image shows an EMA cross chart with both EMA series set to the same index:
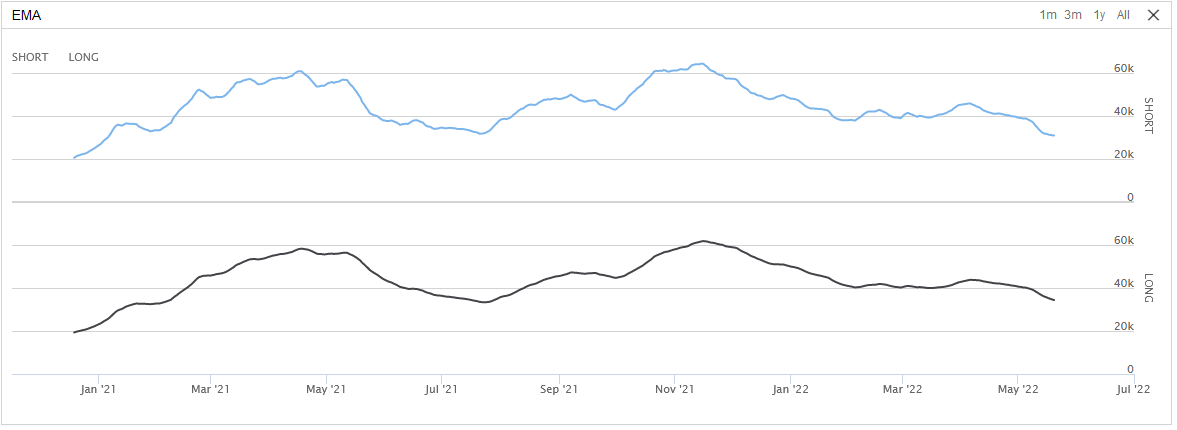
The following image shows the same EMA series, but with the short EMA on index 0 and the long EMA on index 1:
Colors
To view the available Color options, see the Color Struct Properties in the .NET documentation.
Scatter Marker Symbols
The ScatterMarkerSymbol enumeration has the following members:
Candlestick Series
A chart candlestick series displays candlesticks on the chart. To add a candlestick series to a chart, create a CandlestickSeries object and then call the AddSeriesadd_series method.
var candlestickSeries = new CandlestickSeries("<seriesName>");
chart.AddSeries(candlestickSeries);
candlestick_series = CandlestickSeries("<seriesName>")
chart.add_series(candlestick_series)
There are several other headers for the CandlestickSeries constructor.
CandlestickSeries(name)
CandlestickSeries(name, index)
CandlestickSeries(name, index, unit)
CandlestickSeries(name, unit)
The following table describes the constructor arguments:
| Argument | Data Type | Description |
|---|---|---|
name | stringstr | Name of the series |
index | int | Index position on the chart of the series |
unit | stringstr | Unit for the series axis |
The default CandlestickSeries has 0 index and "$" unit.
Plot Series
To add a data point to a chart series, call the Plotplot method. If you haven't already created a chart and series with the names you pass to the Plotplot method, the chart and/or series is automatically created.
Plot("<chartName>", "<seriesName>", value); self.plot("<chartName>", "<seriesName>", value)
The value argument can be an integer or decimal number. If the chart is a time series, the value is added to the chart using the algorithm time as the x-coordinate.
To plot the current value of indicators, call the Plotplot method. The method accepts up to four indicators.
// In Initialize
var symbol = AddEquity("SPY");
var smaShort = SMA(symbol, 10);
var smaLong = SMA(symbol, 20);

// In OnData
Plot("<chartName>", smaShort, smaLong)
# In Initialize
symbol = self.add_equity("SPY")
sma_short = self.sma(symbol, 10)
sma_long = self.sma(symbol, 20)
# In OnData
self.plot("<chartName>", sma_short, sma_long)
To plot all of the values of some indicators, in the Initializeinitialize method, call the PlotIndicatorplot_indicator method. The method plots each indicator value as the indicator updates. The method accepts up to four indicators.
var symbol = AddEquity("SPY");
var smaShort = SMA(symbol, 10);
var smaLong = SMA(symbol, 20);
PlotIndicator("<chartName>", smaShort, smaLong)
symbol = self.add_equity("SPY")
sma_short = self.sma(symbol, 10)
sma_long = self.sma(symbol, 20)
self.plot_indicator("<chartName>", sma_short, sma_long)
Plot Candlestick
To add a sample of open, high, low, and close values to a candlestick series, call the Plotplot method with the data points. If you haven't already created a chart and series with the names you pass to the Plotplot method, the chart and/or series is automatically created.
Plot("<chartName>", "<seriesName>", open, high, low, close); self.plot("<chartName>", "<seriesName>", open, high, low, close)
The open, high, low, and close arguments can be an integer for decimal number. If the chart is a time series, the values are added to the chart using the algorithm time as the x-coordinate.
To plot the current trade bar, call the Plotplot method with a TradeBar argument in the OnDataon_data method.
// In Initialize
var equity = AddEquity("SPY");
var forex = AddForex("EURUSD");

// In OnData
var tradeBar = slice.Bars["SPY"];
var collapsed = slice.QuoteBars["EURUSD"].Collapse();   // Collapses QuoteBar into TradeBar object

Plot("<chartName1>", "<seriesName>", tradeBar)
Plot("<chartName2>", "<seriesName>", collapsed)
# In Initialize
equity = self.add_equity("SPY")
forex = self.add_forex("EURUSD")
# In OnData
trade_bar = slice.bars["SPY"];
collapsed = slice.quote_bars["EURUSD"].collapse() # Collapses QuoteBar into TradeBar object
self.plot("<chartName>", "<seriesName>", trade_bar)
self.plot("<chartName>", "<seriesName>", collapsed)
To plot consolidated bars, call the Plotplot method with a TradeBar argument in the consolidation handler.
// In Initialize
var equity = AddEquity("SPY");
Consolidate(equity.Symbol, TimeSpan.FromMinutes(10), ConsolidationHandler);

// Define the consolidation handler
void ConsolidationHandler(TradeBar consolidatedBar)
{
    Plot("<chartName>", "<seriesName>", consolidatedBar)
}
# In Initialize
equity = self.add_equity("SPY")
self.consolidate(equity.symbol, timedelta(minutes=10), self._consolidation_handler)
# Define the consolidation handler
def _consolidation_handler(self, consolidated_bar: TradeBar) -> None:
self.plot("<chartName>", "<seriesName>", consolidated_bar)
Plot Asset Data
Asset plots display the trade prices of an asset and the following order events you have for the asset:
| Order Event | Icon |
|---|---|
| Submissions | Gray circle |
| Updates | Blue circle |
| Cancellations | Gray square |
| Fills and partial fills | Green (buys) or red (sells) arrows |
The following image shows an example asset plot for AAPL:
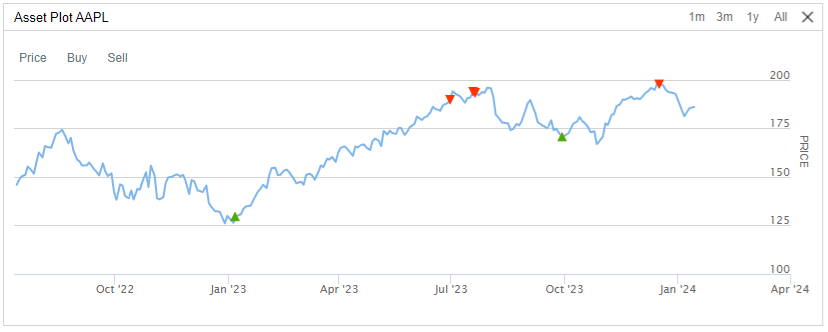
The order submission icons aren't visible by default.
For more information about these charts, including how to view them in QC Cloud, see Asset Plots for backtests or live trading.
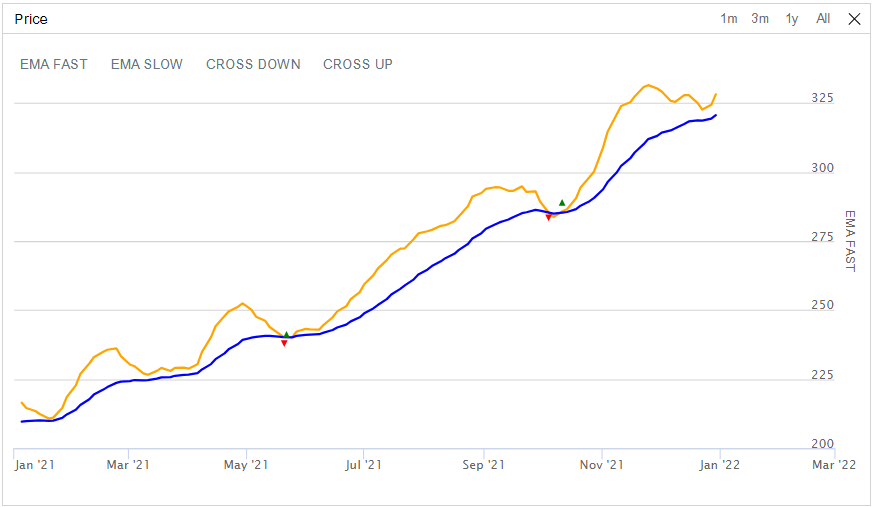
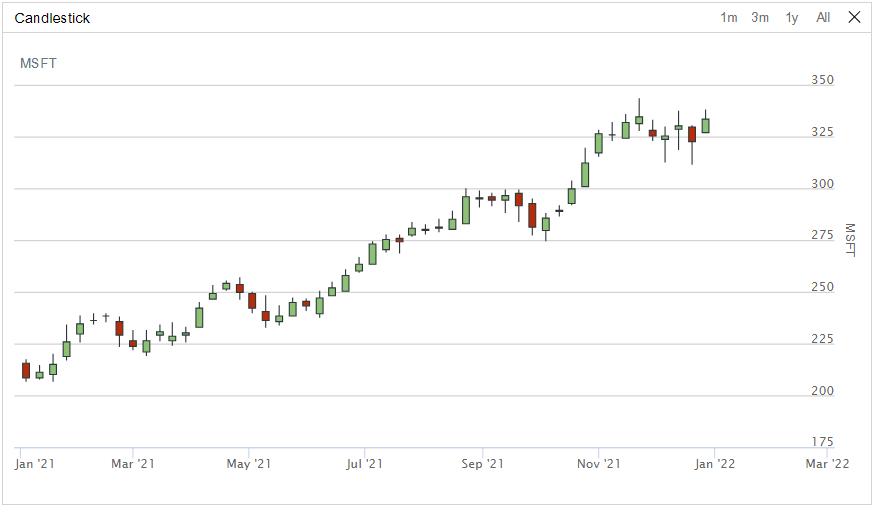
Examples
The following example shows how to plot the daily closing price of SPY with a scatter plot:
public class ChartingDemoAlgorithm : QCAlgorithm
{
    private ExponentialMovingAverage _emaFast;
    private ExponentialMovingAverage _emaSlow;
    public override void Initialize()
    {
        SetStartDate(2021, 1, 1);
        SetEndDate(2022, 1, 1);
        Settings.AutomaticIndicatorWarmUp = true;
        var symbol = AddEquity("MSFT", Resolution.Daily).Symbol;
        _emaFast = EMA(symbol, 10);
        _emaSlow = EMA(symbol, 50);
        var chart = new Chart("Price");
        AddChart(chart);
        chart.AddSeries(new Series("CROSS UP", SeriesType.Scatter, "$", Color.Green, ScatterMarkerSymbol.Triangle));
        chart.AddSeries(new Series("CROSS DOWN", SeriesType.Scatter, "$", Color.Red, ScatterMarkerSymbol.TriangleDown));
        chart.AddSeries(new Series("EMA FAST", SeriesType.Line, "$", Color.Orange));
        chart.AddSeries(new Series("EMA SLOW", SeriesType.Line, "$", Color.Blue));
        chart = new Chart("Candlestick");
        AddChart(chart);
        chart.AddSeries(new CandlestickSeries("MSFT", "$"));
    }

    public override void OnEndOfDay(Symbol symbol)
    {
        Plot("Candlestick", "MSFT", (TradeBar)Securities[symbol].GetLastData());
        Plot("Price", "EMA FAST", _emaFast);
        Plot("Price", "EMA SLOW", _emaSlow);
        if (_emaFast > _emaSlow && _emaFast[1] < _emaSlow[1])
            Plot("Price", "CROSS UP", Securities[symbol].Price);
        else if (_emaFast < _emaSlow && _emaFast[1] > _emaSlow[1])
            Plot("Price", "CROSS DOWN", Securities[symbol].Price);
    }
}
class ChartingDemoAlgorithm(QCAlgorithm):
def initialize(self) -> None:
self.set_start_date(2021, 1, 1)
self.set_end_date(2022, 1, 1)
self.settings.automatic_indicator_warm_up = True
symbol = self.add_equity("MSFT", Resolution.DAILY).symbol
self.ema_fast = self.ema(symbol, 10)
self.ema_slow = self.ema(symbol, 50)
chart = Chart("Price")
self.add_chart(chart)
chart.add_series(Series("CROSS UP", SeriesType.SCATTER, "$", Color.green, ScatterMarkerSymbol.TRIANGLE))
chart.add_series(Series("CROSS DOWN", SeriesType.SCATTER, "$", Color.red, ScatterMarkerSymbol.TRIANGLE_DOWN))
chart.add_series(Series("EMA FAST", SeriesType.LINE, "$", Color.orange))
chart.add_series(Series("EMA SLOW", SeriesType.LINE, "$", Color.blue))
chart = Chart("Candlestick")
self.add_chart(chart)
chart.add_series(CandlestickSeries("MSFT", "$"))
def on_end_of_day(self, symbol: Symbol) -> None:
self.plot("Candlestick", "MSFT", self.securities[symbol].get_last_data())
self.plot("Price", "EMA FAST", self.ema_fast.current.value)
self.plot("Price", "EMA SLOW", self.ema_slow.current.value)
if (self.ema_fast > self.ema_slow and self.ema_fast[1] < self.ema_slow[1]):
self.plot("Price", "CROSS UP", self.securities[symbol].price)
elif (self.ema_fast < self.ema_slow and self.ema_fast[1] > self.ema_slow[1]):
self.plot("Price", "CROSS DOWN", self.securities[symbol].price)
To see a full example, run the CustomChartingAlgorithmCustomChartingAlgorithm.
View Charts
The following table describes where you can access your charts, depending on how to deploy your algorithms:
| Location | Algorithm Lab Algorithms | CLI Cloud Algorithms | CLI Local Algorithms |
|---|---|---|---|
| Backtest results page |  | | |
| Live results page | | | |
| /backtests/read endpoint | | | |
| /live/read endpoint | | | |
| ReadBacktest method | | | |
| ReadLiveAlgorithm method | | | |
| Local JSON file in your <projectName> / backtests / <timestamp> or <projectName> / live / <timestamp> directory | | |
Quotas
When you run backtests, you must stay within the plotting quotas to avoid errors.
Cloud Quotas
Intensive charting requires hundreds of megabytes of data, which is too much to stream online or display in a web browser. The number of series and the number of data points per series you can plot depends on your organization tier. The following table shows the quotas:
| Tier | Max Series | Max Data Points per Series |
|---|---|---|
| Free | 10 | 4,000 |
| Quant Researcher | 10 | 8,000 |
| Team | 25 | 16,000 |
| Trading Firm | 25 | 32,000 |
| Institution | 100 | 96,000 |
If you exceed the series quota, your algorithm stops executing and the following message displays:
If you exceed the data points per series quota, the following message displays:
If your plotting needs exceed the preceding quotas, create the plots in the Research Environment instead.
Local Quotas
If you execute local backtests, the charting quotas are set by the maximum-chart-series and maximum-data-points-per-chart-series configuration settings.
You can also see our Videos. You can also get in touch with us via Discord.
Did you find this page helpful?